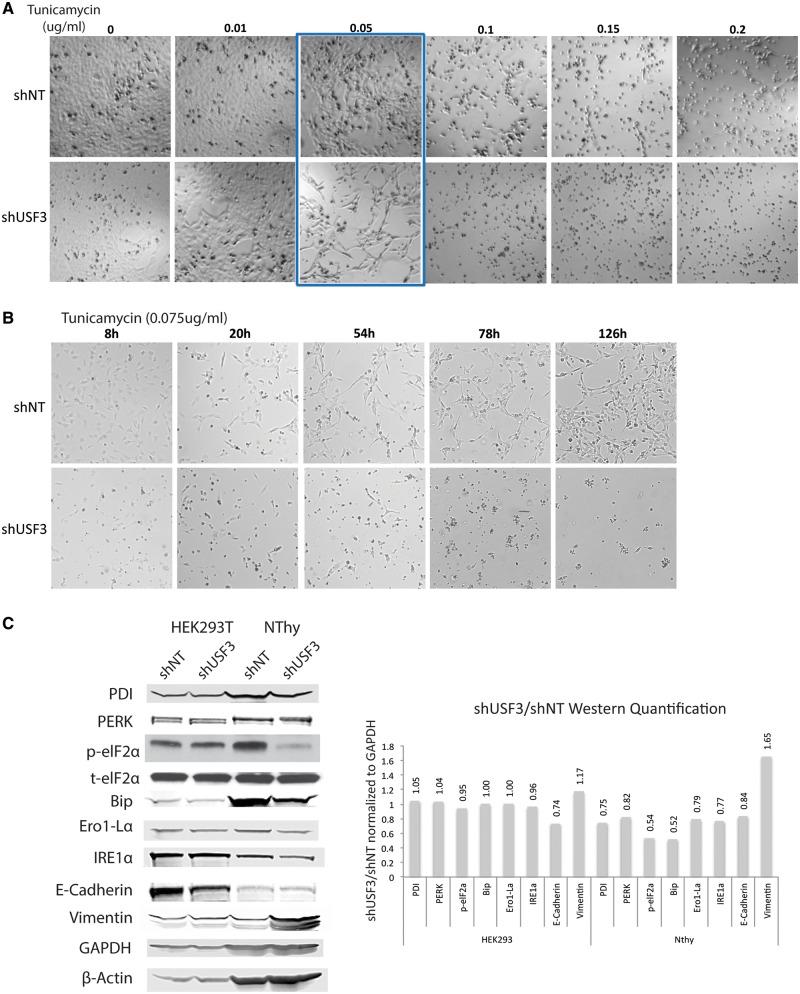
Figure 6.
USF3 knock down cells are sensitive to ER stress induction via tunicamycin treatment. (A) Phase-contrast microscopy images of the dose-response tunicamycin treatment in shNT or shUSF3 NThy-ori 3-1 cells. Cells were treated with 0 – 0.2 µg/ml tunicamycin for 72 h. As highlighted in the blue box, tunicamycin treatment, around the 0.05 µg/ml concentration, killed more shUSF3 cells (lower panel) compared to shNT cells (upper panel). (B) Phase-contrast microscopy images of the time-course tunicamycin treatment in shNT or shUSF3 cells. Cells were treated with a single dose of 0.075 µg/ml tunicamycin for 8–126 h. shNT cells showed normal attached morphology and even continued to proliferate after 126 h of treatment (upper panel series). However, shUSF3 cells remained rounded in shape and virtually all died after 126 h (lower panel series) (C) Western blot for UPR markers PDI, PERK, eIF2α, Bip, Ero1-Lα, EMT markers E-cadherin and Vimentin in shNT and shUSF3 stably transfected HEK293 and NThy cells. GAPDH and β-Actin were used as loading controls. Quantification of Western blots was performed with ImageJ and presented in the bar figure on the right side. Relative ratio annotated on top of each bar was calculated by protein expression level relative to GAPDH except p-eIF2α relative to t-eIF2α, and compared between shUSF3 to shNT. PDI - Protein disulfide isomerase, PERK - Protein kinase R (PKR)-like endoplasmic reticulum kinase, eIF2α - Eukaryotic translation initiation factor 2A, Bip - Binding immunoglobulin protein, Ero1-Lα - ERO1-like protein alpha, IRE1α - inositol-requiring enzyme 1.

