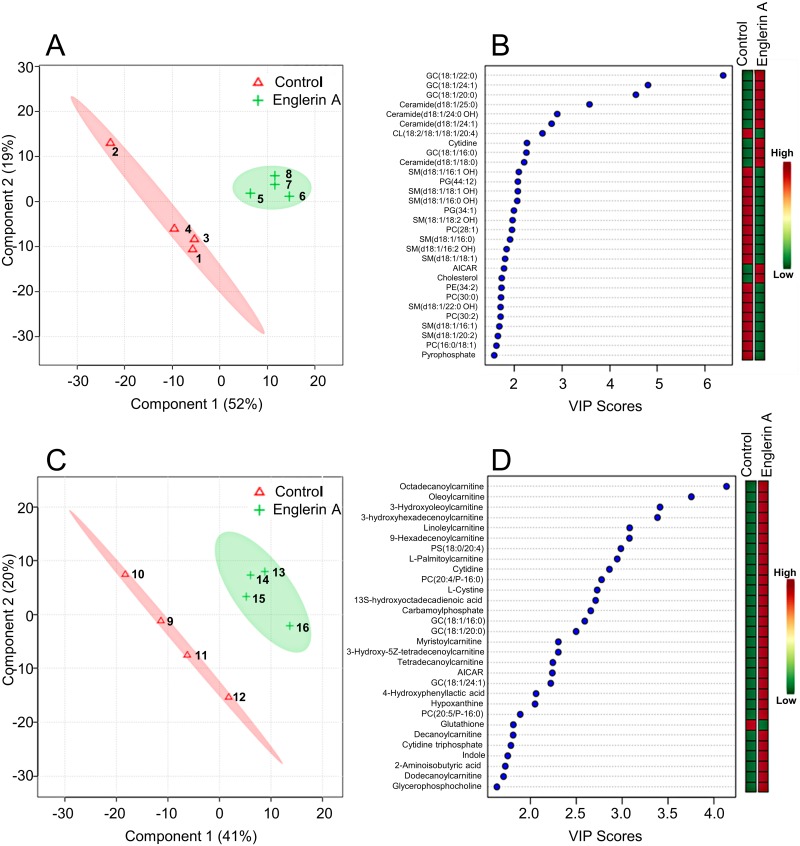
Fig 1. Multivariate analysis of metabolites altered by englerin A in renal cancer cells.
Multivariate analysis using partial least squares discriminant analysis (PLSDA) clearly distinguished control and englerin A treated groups of A498 cells at both 24 h (A and B) and 48 h (C and D) durations of treatment. Panels B and D list the top metabolites and their VIP scores and indicate how they are altered compared to control. Numbers within shaded areas in graphs A and C represent samples within control and treated groups.

