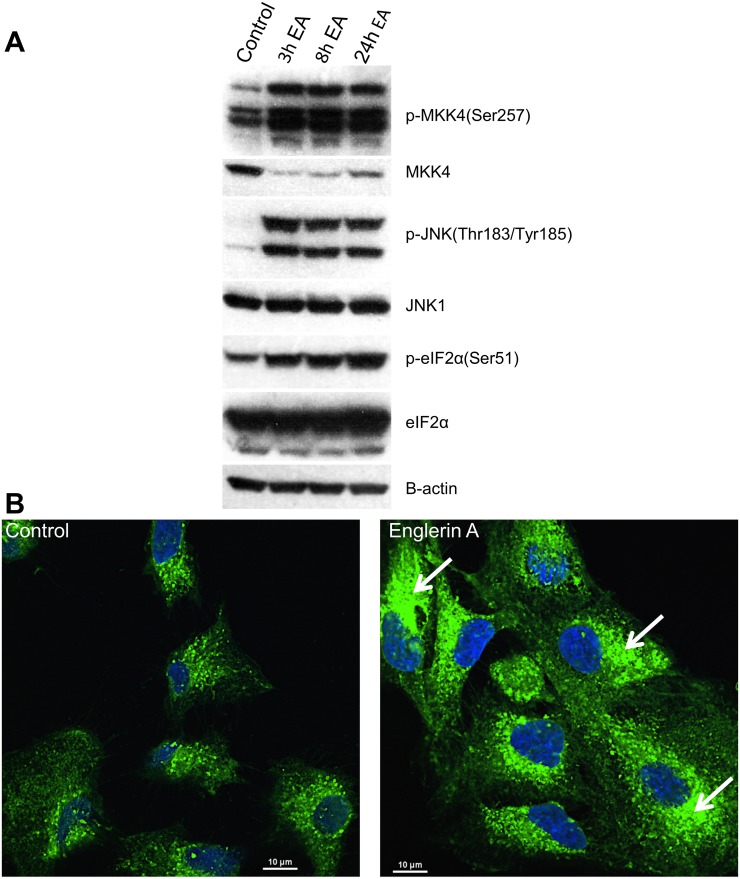
Fig 2. Englerin A induces ER stress signaling and morphological changes in the ER.
Western blot analysis (A) was performed using protein extracts obtained from A498 cells treated with 0.1% DMSO (vehicle) or 100 nM englerin A for the indicated times. ER morphology (B) was imaged by fluorescence confocal microscopy of UO-31 cells that were treated with vehicle or 25 nM englerin A for 28.5h followed by staining of cells with ER-ID® Green and Hoechst stain. Arrows show areas of the ER with disrupted fine tubular network.

