
Fig. 1. Map of the trifurcation area of the SJFZ.
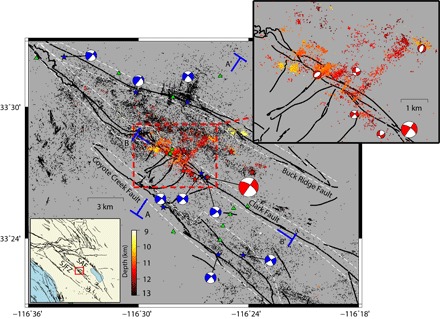
Historical seismicity is denoted by black dots (20). Events with M > 4.0 that have occurred in this area since 2001 are indicated by blue stars and focal mechanisms. Aftershocks of the 2016 Borrego Springs earthquake are colored by depth. Red stars and focal mechanisms indicate aftershocks with M > 3.0. Stations used are denoted by green triangles. The inset contains a close-up of the detected aftershocks, which delineate numerous strike-slip and normal faults in conjugate orientations. Profiles of seismicity along cross secitons A–A′ and B–B′ are shown in Figs. 2 and 3. SAF, San Andreas fault.