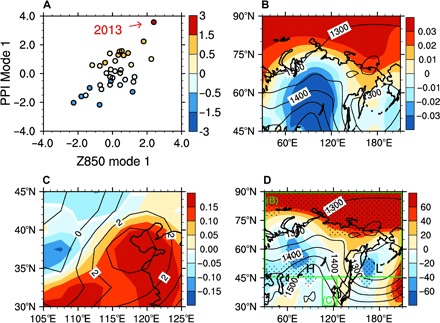
Fig. 2. Influence of the regional circulation on PPI.

(A) The first MCA mode intensity (circles; unitless) of January PPI and Z850; color shading (unitless) denotes PPI values from 1981 to 2015; (B) the spatial pattern of the first Z850 MCA mode (color shading; unitless) and Z850 climatology (contour lines; in meters); (C) the spatial pattern of the first PPI MCA mode (color shading; unitless) and PPI fields (contour lines; unitless) in 2013; (D) the 2013 Z850 anomalies (color shading; in meters) and Z850 climatology (contour lines; in meters). In (D), black dots denote the 95% significance level based on the bootstrapping method; green rectangles denote the regions of subplots (B) and (C); H and L indicate the location of the Siberian High and the Aleutian Low, respectively. All results are for January.
