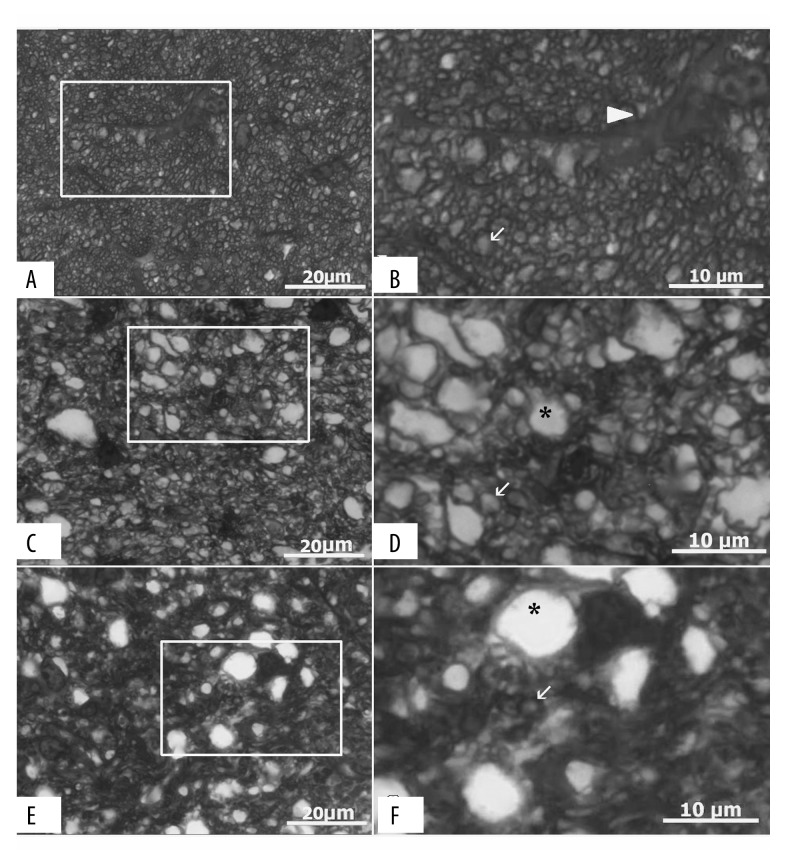
Figure 4.
Representative photomicrographs (100× magnification) showing optic nerve sections from control (A), ONC (C), and memantine (E) groups. Scale bar 50 μm. Boxed areas are enlarged (B, D, F). Images A and B show a healthy optic nerve, while C–F were graded as moderate optic nerve damage. Arrow head indicates astrocyte (B), arrows – axons (B, D, F), and asterisks point to swollen axons (D, F). ONC – optic nerve crush.

