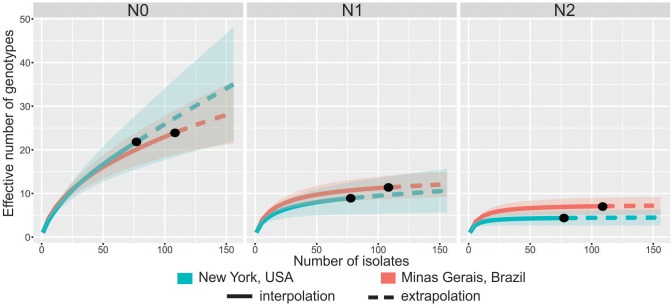
Fig 2. Diversity accumulation curves for different sample sizes with 95% confidence intervals (shaded areas) of the Hill’s numbers or effective number of genotypes of orders 0 (N0), 1 (N1) and 2 (N2) estimated for the Sclerotinia sclerotiorum populations from New York, USA and Minas Gerais, Brazil.
The N0, N1 and N2 numbers correspond to genotype richness, the exponential of Shannon’s entropy, and the inverse of the Simpson’s concentration indices, respectively. Solid lines correspond to rarefaction (interpolation) and dashed lines to extrapolation curves up to the base sample size of 156 individuals which corresponds to double the smaller reference sample size (NY = 78). The 95% confidence intervals were obtained by a bootstrap method based on 200 replications.

