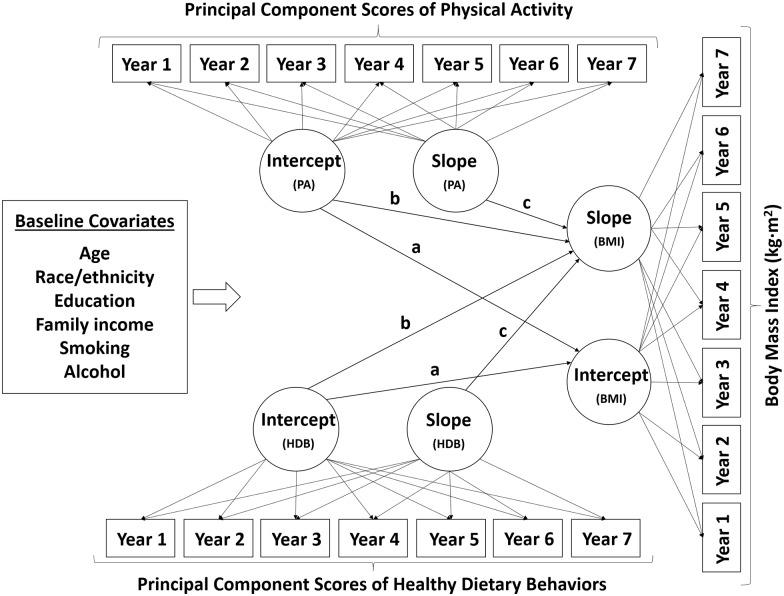
Fig 1. A schematic diagram depicting the parallel latent growth curve model controlling for baseline covariates.
‘a’ denotes the paths examining the cross-sectional associations of baseline PA and HDB with baseline BMI (Intercept(PA) → Intercept(BMI); Intercept(HDB) → Intercept(BMI)). ‘b’ denotes the paths examining the prospective associations of baseline PA and HDB with change in BMI (Intercept(PA) → Slope(BMI); Intercept(HDB) → Slope(BMI)). ‘c’ denotes the parallel associations of changes in PA and HDB with change in BMI (Slope(PA) → Slope(BMI); Slope(HDB) → Slope(BMI)).

