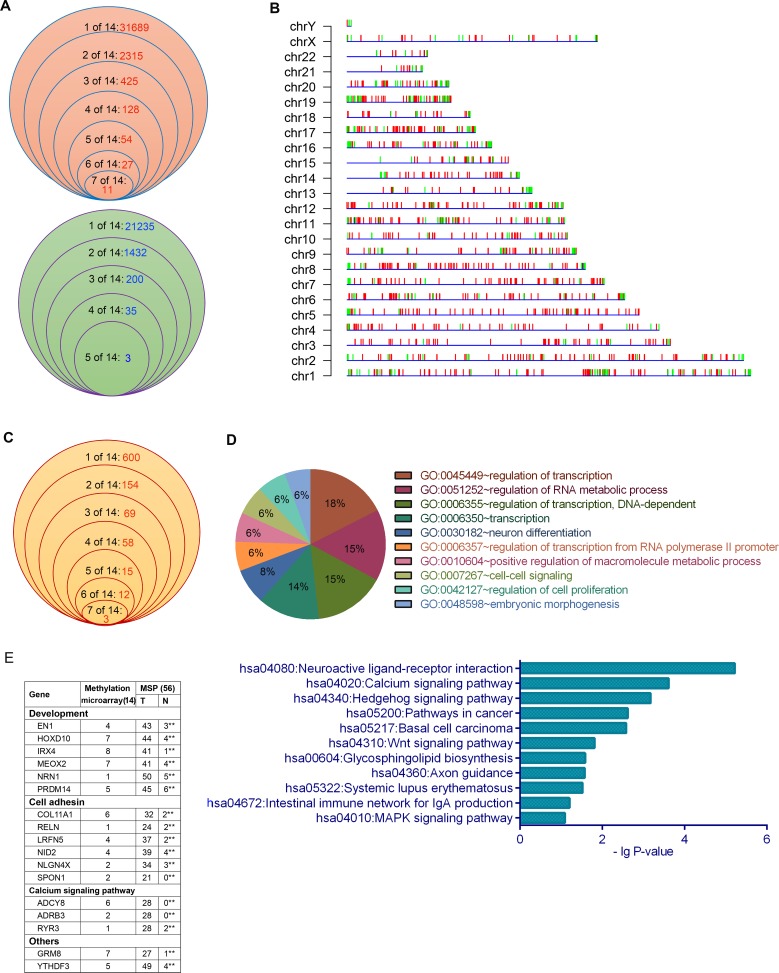
Figure 1. DNA methylation profiling in XWLC tissues.
A. The frequency of hypermethylated (above) and hypomethylated (below) regions with a peak score ≥ 2 and |log2 ratio| > 0 in the 14 XWLC tissues. B. Chromosomal distribution of DMRs with a peak score ≥ 2 and |log2 ratio| > 1 in the 14 XWLC tissues. Red and green vertical lines represent hypermethylated and hypomethylated regions, respectively. C. The frequency of genes whose promoters contained DMRs with a log2 ratio > 1 in the 14 XWLC tissues. D. GO and KEGG analyses of genes whose promoters contained DMRs with a log2 ratio > 1. E. Methylation analysis of the 17 selected genes using MSP in the 56 paired XWLC tissues, **P < 0.01 (chi-square test).

