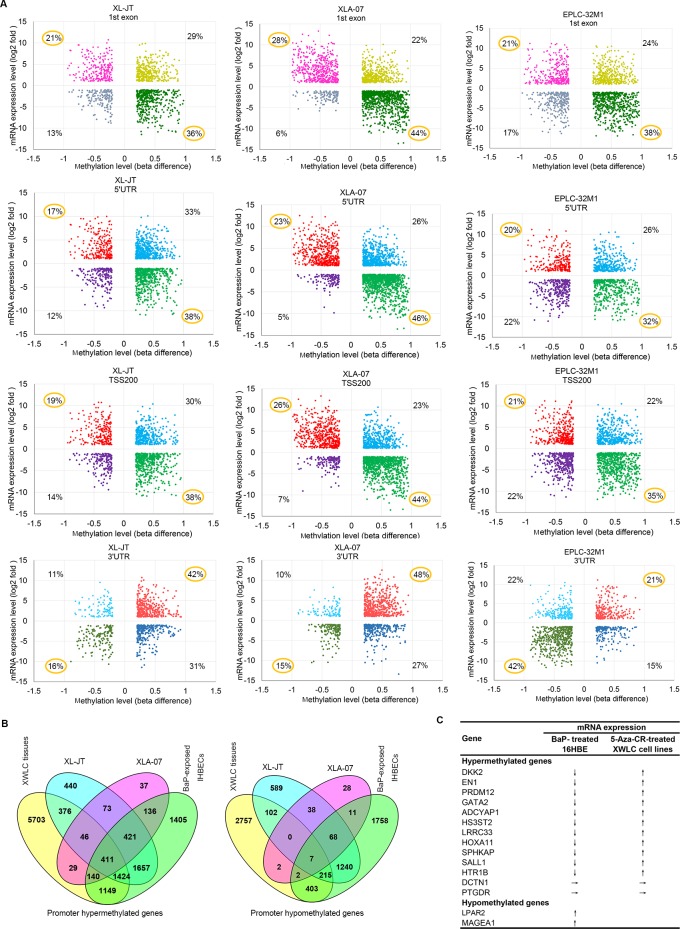
Figure 5. Relationships between DNA methylation and gene expression.
A. Starburst plot of genes showing the relationships between methylation levels (x-axis) at various regions (first exon, 5′UTR, TSS200, and 3′UTR) of genes and mRNA levels (y-axis) in lung cancer cell lines. B. Venn diagram showing overlap of promoter hypermethylated and hypomethylated genes among XWLC cell lines (XL-JT, XLA-07), XWLC tissues, and BaP-exposed IHBECs. In A and B, genes were selected according to the strategies described in Supplementary Figure 5A and 5C, respectively. C. mRNA expression levels of the 15 genes with differentially methylated promoters were changed in 16HBE cells treated with BaP and in cultured XWLC cells treated with 5-Aza-CR. ↓, ↑, and → represent down-regulation, up-regulation, and no change, respectively.

