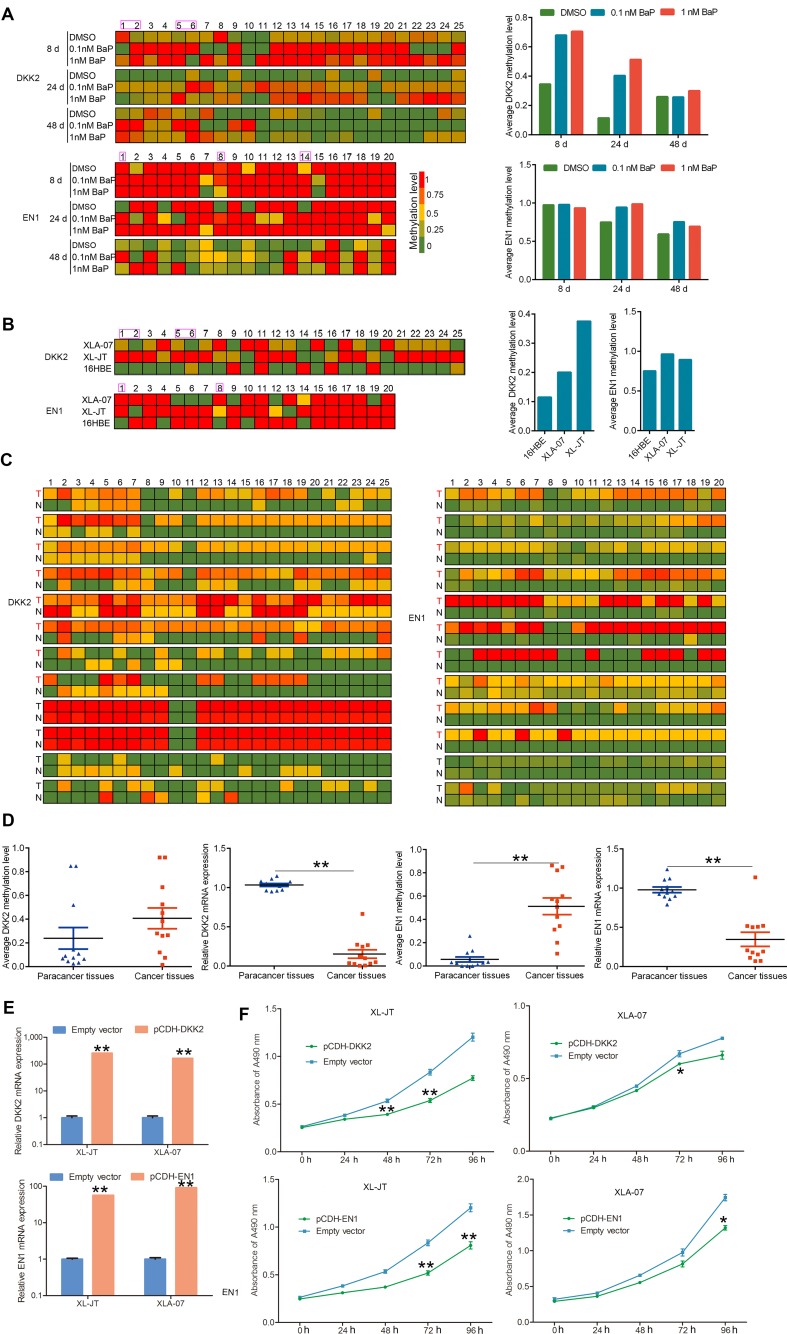
Figure 6. Quantitative analysis of promoter hypermethylation and mRNA expression, and functional investigation of DKK2 and EN1.
A-C. Methylation statuses of the 25 and 20 CpG dinucleotides around the promoter region of DKK2 and EN1 were measured by BSP in BaP-exposed 16HBE cells (A), XWLC cell lines (XL-JT and XLA-07) and 16HBE cells (B), and the 12 paired XWLC tissues (C). In A and B, left: the methylation level of each CpG dinucleotide; right: the average methylation levels of total CpG dinucleotides analyzed at gene promoters. In C, methylation level of each CpG dinucleotide; T stands for XWLC tissues, N stands for adjacent normal tissues. D. Promoter methylation and mRNA expression levels were examined in the 12 paired XWLC tissues by BSP and qRT-PCR, respectively. Promoter methylation levels are represented by the average methylation levels of total CpG dinucleotides analyzed around the gene promoters. The results were analyzed using Student's t-test (**P < 0.01, *P < 0.05) and were expressed as the mean ± standard error (SE). E, F. Induced expression of DKK2 and EN1 inhibited cell proliferation in cultured XWLC cells after gene transfection. The specific over-expression of DKK2 and EN1 mRNA was confirmed by qRT-PCR after gene transfection compared to empty vector transfection (E). Cell proliferation was measured by MTS assay, and absorbance was measured at 490 nm (F). In E and F, results are presented as the mean ± standard error (SE) of triplicate experiments, which were analyzed using Student's t-test (**P < 0.01, *P < 0.05).

