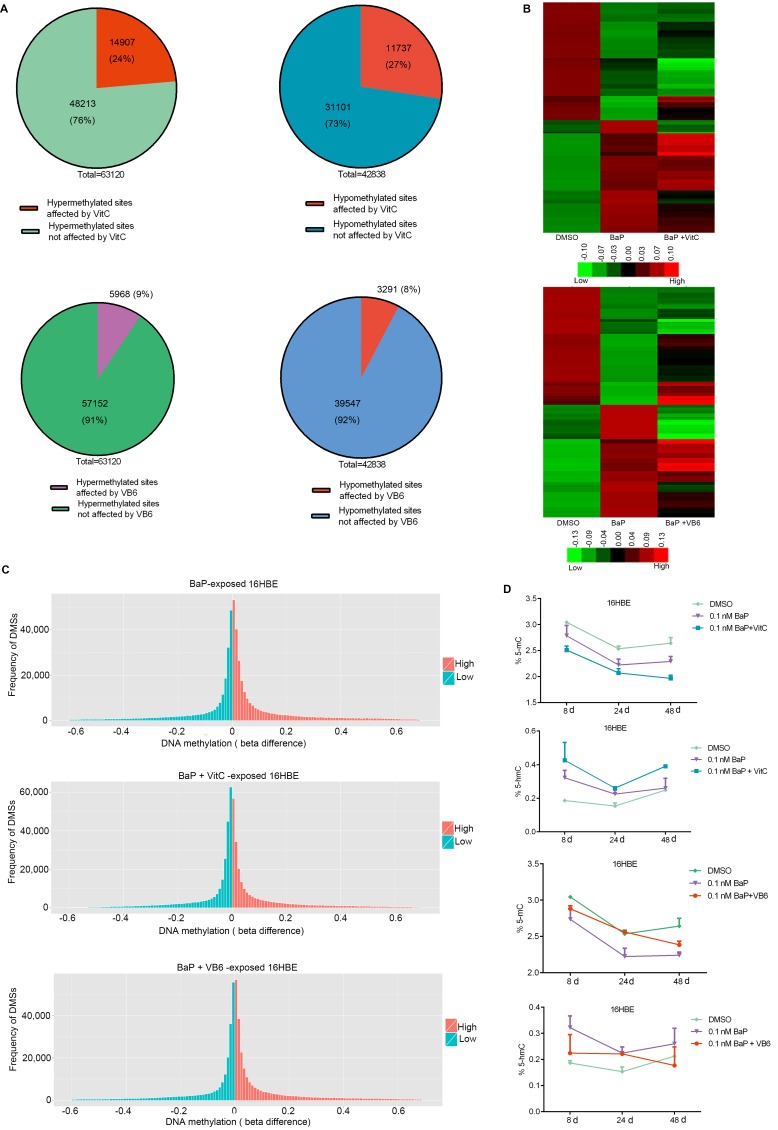
Figure 8. Comparison of DNA methylation among BaP-treated 16HBE cells after VitC and VB6 intervention.
A. Number of DMSs that were affected in BaP-treated 16HBE cells after VitC and VB6 intervention. B. Comparison of DNA methylation statuses using a heat-map. Top: treated with DMSO, BaP, and BaP plus VitC (BaP + VitC); bottom: treated with DMSO, BaP, and BaP plus VB6 (BaP + VB6). The heat map provides a visualization of β values. Red: high methylation; green: low methylation. C. Comparison of total DNA methylation status using normalized histogram of DMSs in 16HBE cells treated with BaP, BaP + VitC, and BaP + VB6. Red: high methylation; green: low methylation. In A-C, DMSs were obtained through comparing BaP, BaP + VitC, and BaP + VB6 treatments with DMSO treatment. D. 5-mC and 5-hmC levels were measured by ELISA in 16HBE cells treated with BaP, BaP + VitC, and BaP + VB6; the results were analyzed using Student's t-test (**P < 0.01, *P < 0.05). DMSO: solvent control.

