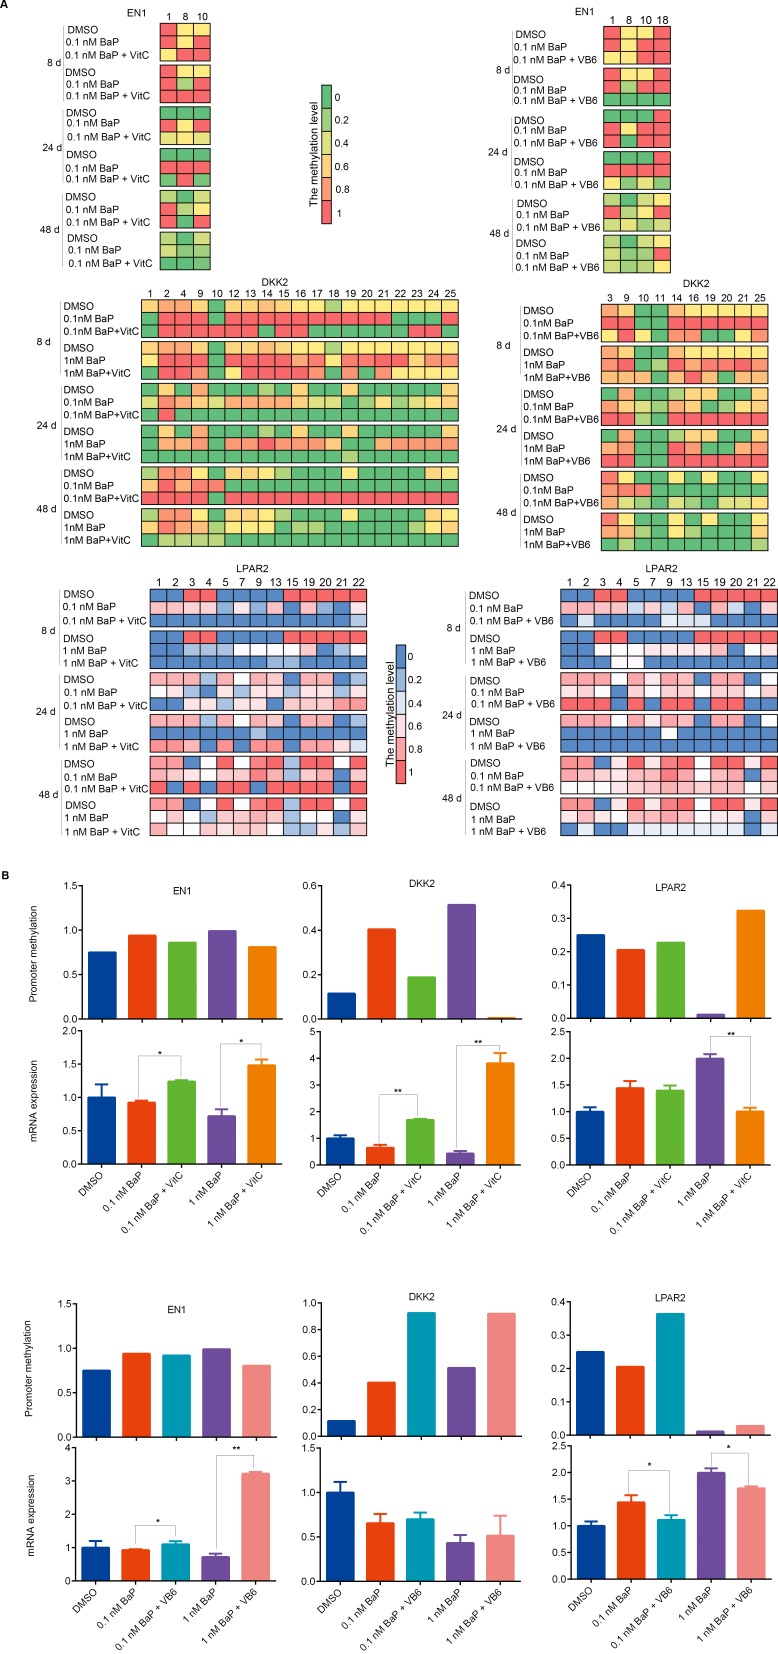
Figure 9. Comparison of promoter methylation and mRNA expression of EN1, DKK2, and LPAR2 after combination treatments.
A. Methylation statuses of the CpG dinucleotides around EN1, DKK2 and LPAR2 promoters were measured by BSP in 16HBE cells treated with BaP, BaP plus VitC (BaP + VitC), and BaP plus VB6 (BaP + VB6). CpG dinucleotides whose methylation statuses were changed by the VitC and VB6 intervention are shown. B. Integrative analyses of the promoter methylation and mRNA expression levels of EN1, DKK2, and LPAR2 in 16HBE cells treated with BaP, BaP + VitC, and BaP + VB6 for 24 days. The promoter methylation levels are presented as the average methylation levels of total CpG dinucleotides analyzed around gene promoters. The mRNA expression levels were measured by qRT-PCR.

