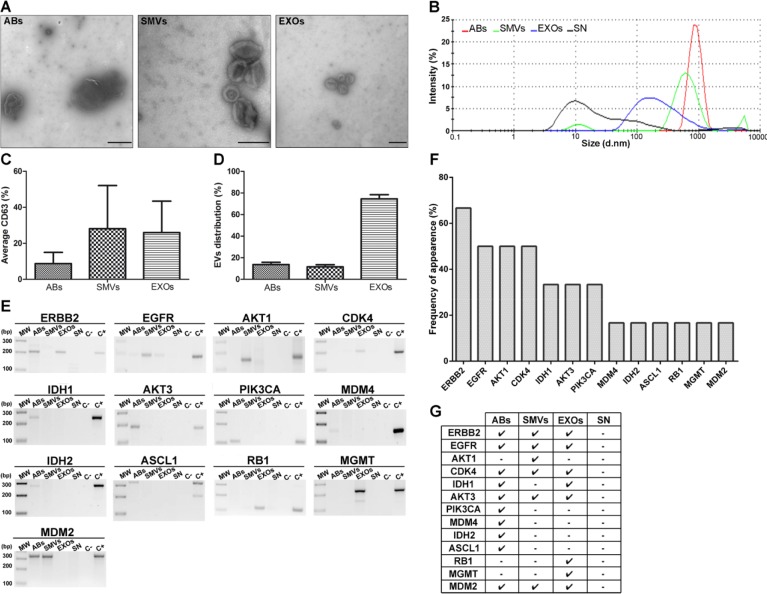
Figure 3. Morphological characterisation of EVs isolated from hCSCs supernatant from GBM27 and gDNA isolation.
A. Transmission electron microscopy images. ABs (500 nm to 1 μm), SMVs (500–150 nm) and EXOs (150–60 nm). B. Size distribution of EVs, as measured using Nanosizer tracking analysis. C. Quantification of the tetraspanin cell-surface glycoprotein CD63. D. Relative distribution of EVs. E. Most representative sequences analyzed are present in EVs isolated from GBM27 cells. F. Histogram showing the frequency of occurrence of target sequences after 6 consecutive experiments. G. Presence of ERBB2, CDK4, AKT3, and MDM2 sequences in all types of EVs. The remaining sequences were found randomly in ABs, SMVs, and EXOs. No sequences were detected in the supernatant. Scale bars: 1 μm (ABs), 0.2 μm (SMVs and EXOs).

