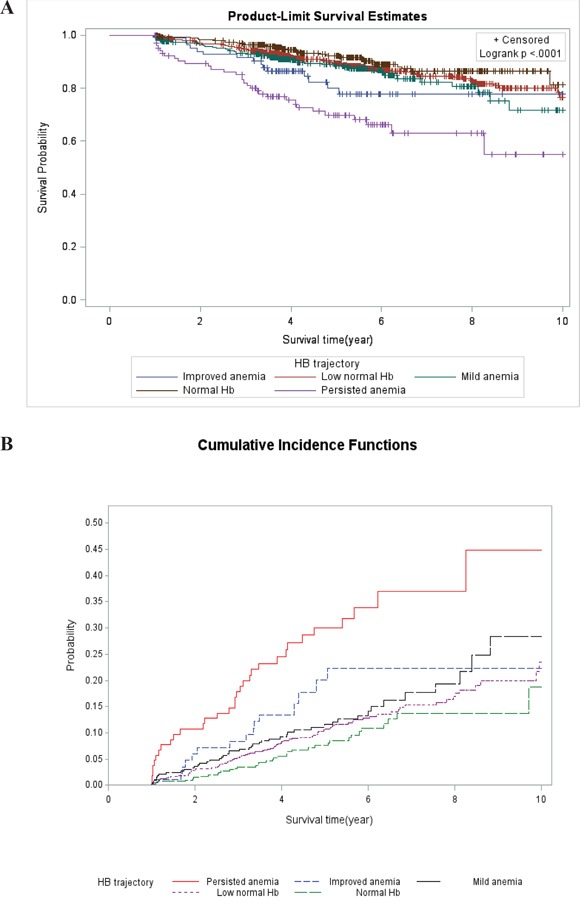
Figure 2. The 10-year survival curve according to the trajectory groups.

The highest mortality rate occurred for the persistent anemia group. The highest survival rate occurred for the normal Hb group. Survival curve of Kaplan-Meier analysis by Hb trajectory is shown (2A). The cumulative incidence by trajectory groups is plotted (2B).
