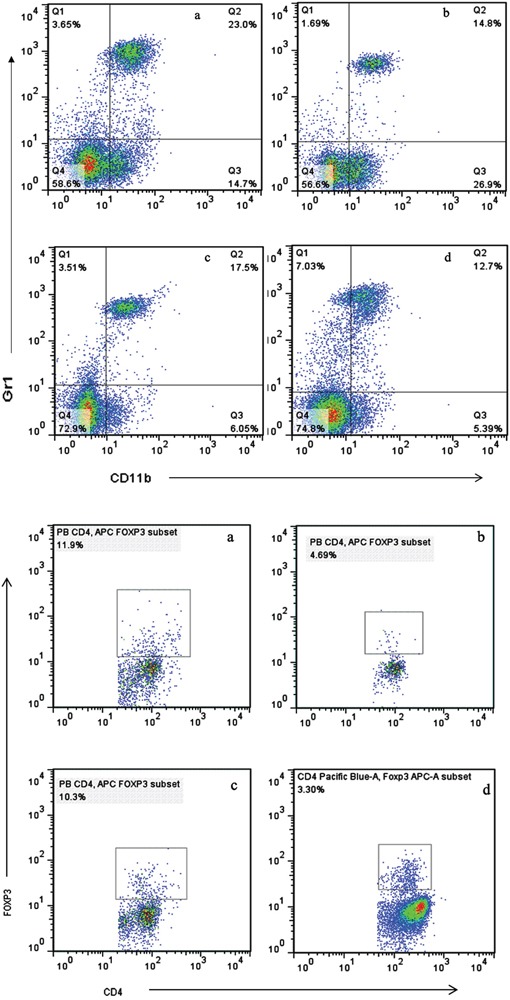
Figure 4. Levels of MDSCs (CD11b+Gr1+).

A. and Tregs (CD4+FoxP3+) B. in peripheral blood, analyzed by multicolor fluorescence cytometry. a Control, b Sunitnib, c Celecoxib, d Celecoxib+Sunitnib.

A. and Tregs (CD4+FoxP3+) B. in peripheral blood, analyzed by multicolor fluorescence cytometry. a Control, b Sunitnib, c Celecoxib, d Celecoxib+Sunitnib.