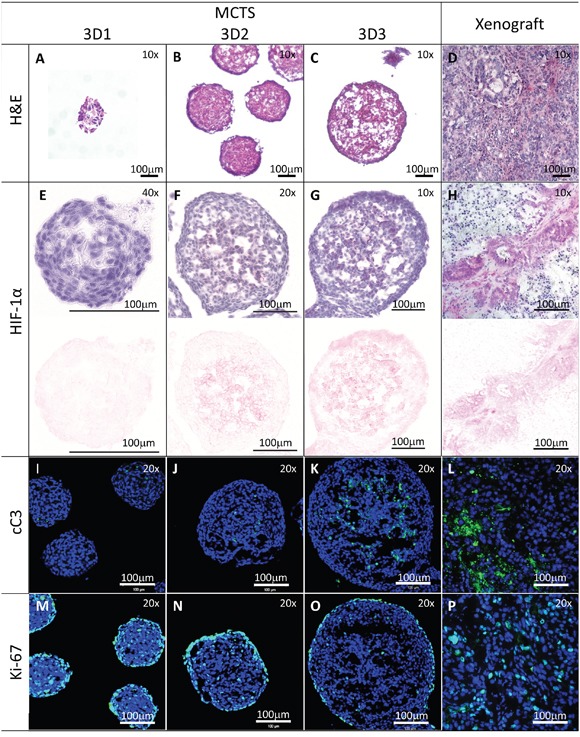
Figure 2. Histological characterization of MCTS of different sizes.

Sections from HT29 MCTS at the indicated stages or from xenografts generated in immunodeficient mice were stained with H&E panels A-D. or stained with anti-HIF-1α (panels E-H.; upper panel HIF-1α and counterstaining with Hematoxylin, lower panel color deconvolution to show the HIF-1α positivity only), anti-cleaved Caspase 3 (cC3, panels I-L., green) or anti-Ki-67 antibodies (panels M-P., green). Sections from panels I-P were counterstained with DAPI (blue). Panels A-D, G, H: magnification 10x; panels F, G, I-P: magnification 20x; panel E: magnification 40x. Scale bar 100μm.
