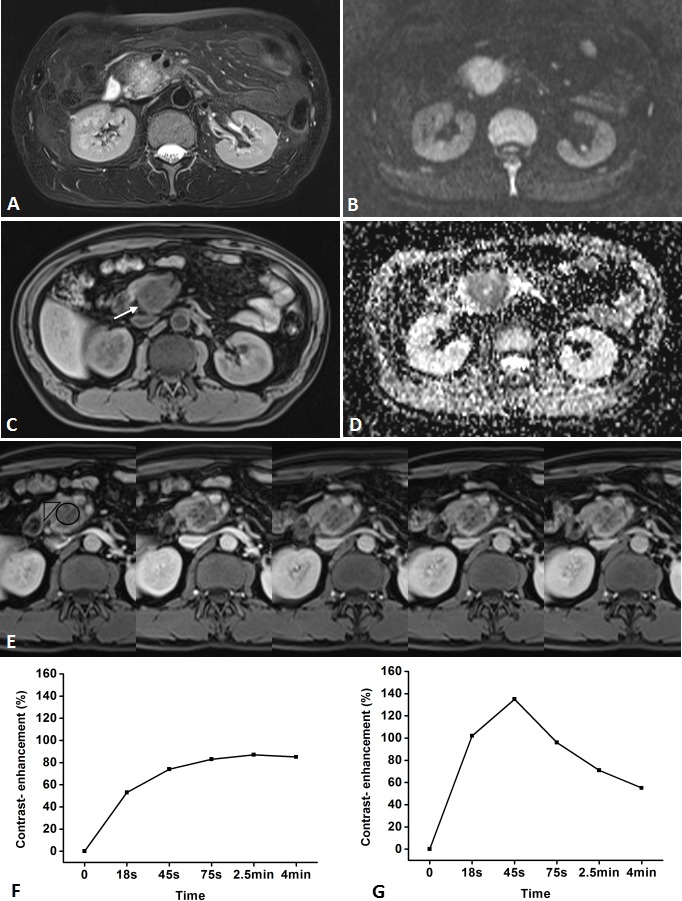
Figure 2. Representative pancreatic T2-weighted image (A), DWI with a b value of 600 s/mm2 (B), T1-weighted image (C), ADC map (D), DCE-MR images (E), and TIC profiles (F, G) in a 49-year-old man with pancreatic carcinoma in the head of pancreas (white arrow).

DCE-MR images: 18s, 45s, 75s, 2.5 and 4 min aftercontrast injection with constant gray scale. The ROIs of mass and non-mass adjacent parenchyma (NAP) indicated with black circle and black triangle. Pancreatic mass demonstrates type-IV b TIC which shows a slow, gradually increasing enhancement pattern followed by a plateau, while NAP demonstrates type-II aTIC which shows a rapidly increasing then gradually decreasing enhancement pattern. DWI shows pancreatic mass is clearly seen as hyperintense with a well-defined margin.
