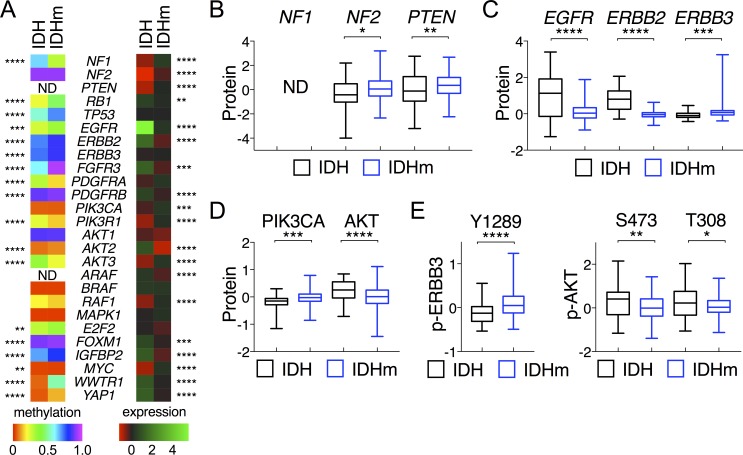
Figure 2. Comparative analysis of DNA methylation and gene expression between IDH-wildtype and IDH-mutant gliomas.
A. Heat maps of mean DNA methylation values (left) and mean mRNA levels (right) of corresponding genes are presented with statistical significance marked between IDH and IDHm groups. B.-D. Protein abundance (in z-scores) of specified genes are presented in box-and-whisker plots. E. Phosphorylation of ERBB3 (p-ERBB3) at Y1289 and AKT (p-AKT) at S473 and T308 are presented in the same way as above. Unpaired t-tests were performed for comparison between IDH and IDHm groups. *, p < 0.05; ***, p < 0.001.

