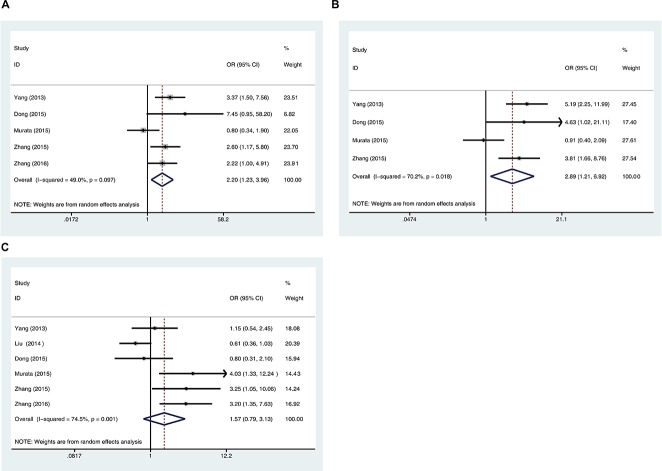
Figure 2. Correlation of 5-hmC levels and cancer stages.
A. Forest plots of the association between negative/low 5-hmC levels and lymph node metastasis (positive vs negative). B. Forest plots of the association between negative/low 5-hmC levels and TNM stage (III/IV stage vs I/II stage). C. Forest plots of the association between negative/low 5-hmC levels and histological differentiation grade (poor vs well/moderate). The squares and horizontal lines correspond to the study-specific OR and 95% CI, respectively. The area of the squares reflects the weight (inverse of the variance). The diamond represents the summary OR and 95% CI.

