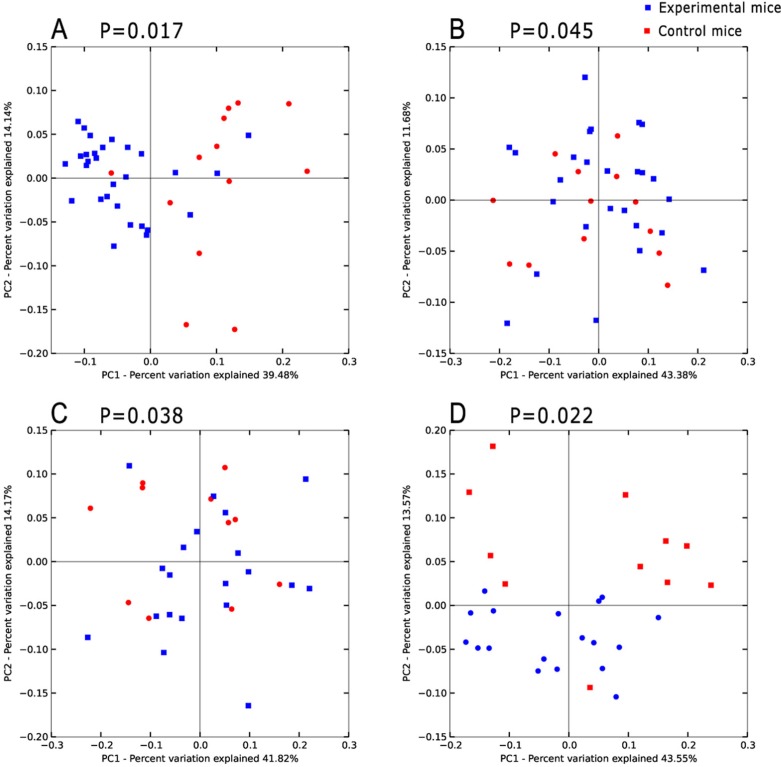
Figure 2. Principal coordinates analysis(PCoA)scores plot basedon relative abundance of OTUs (97% similarity level).
(A–D) represent inflammatory, hyperproliferation, adenoma and carcinoma groups and the relevant control group respectively. Each symbol represents a sample. The blue symbol represents experimental mice and the red symbol control mice. Principal coordinates analysis was carried out using QIIME v1.5.0.

