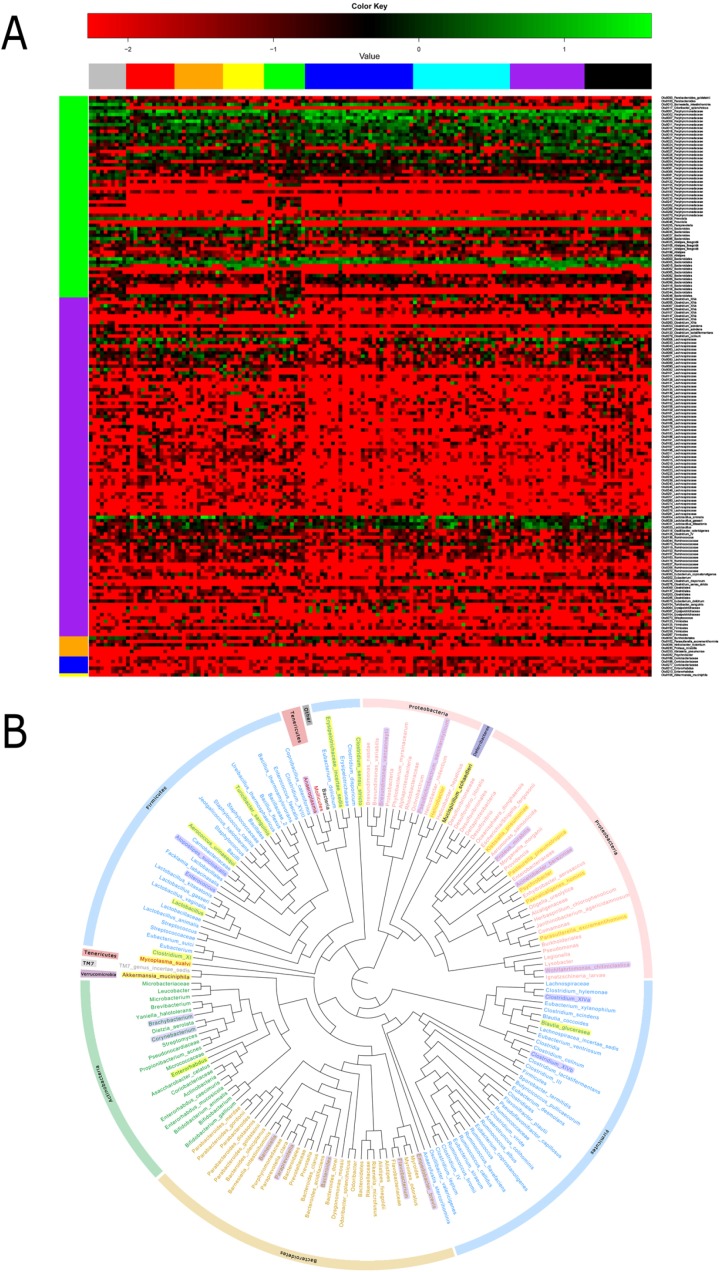
Figure 5. Heatmap and phylogenetic tree of significant differential OTUs.
(A) Log-fold-change and heatmap of significant differential OTUs (P < 0.05). (B) Significant differential genera between the experimental and control groups. Generashaded in yellow represent enrichment in the experimental group, and thoseshaded in purple shade represent enrichment in the control group. The analysis was by QIIME (Version 1.50) software, using an iterative algorithm to obtain clustering tree to R (Version 2.15.3) drawing. Clustering method UPGMA (Unweighted Pair Group Method with Arithmetic mean).

