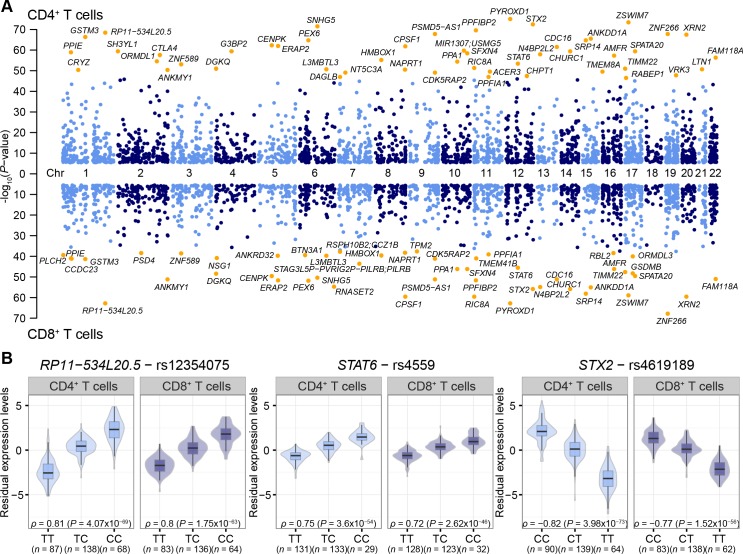
Fig 1. Summary of cis-eQTL analysis in CD4+ and CD8+ T cells.
(A) Manhattan plots of the significant cis-eQTLs per gene in CD4+ (top) and CD8+ T cells (bottom). The names of the top 50 genes per cell type are shown. (B) Examples of genes with cis-eQTLs: RP11−534L20.5 is located downstream of the IKBKE gene which has an essential role in regulating inflammatory responses to viral infections; STAT6 is involved in T cell differentiation; and STX2 is involved in intracellular transport of vesicles. The allelic effect of the SNPs on gene expression levels are shown by boxplots within violin plots. Violin plot shows the density plot of the data on each side, the lower and upper border of the box correspond to the first and third quartiles, respectively, the central line depicts the median, and whiskers extends from the borders to ±1.5xIQR, where IQR stands for inter-quantile range, the distance between the first and third quantiles.

