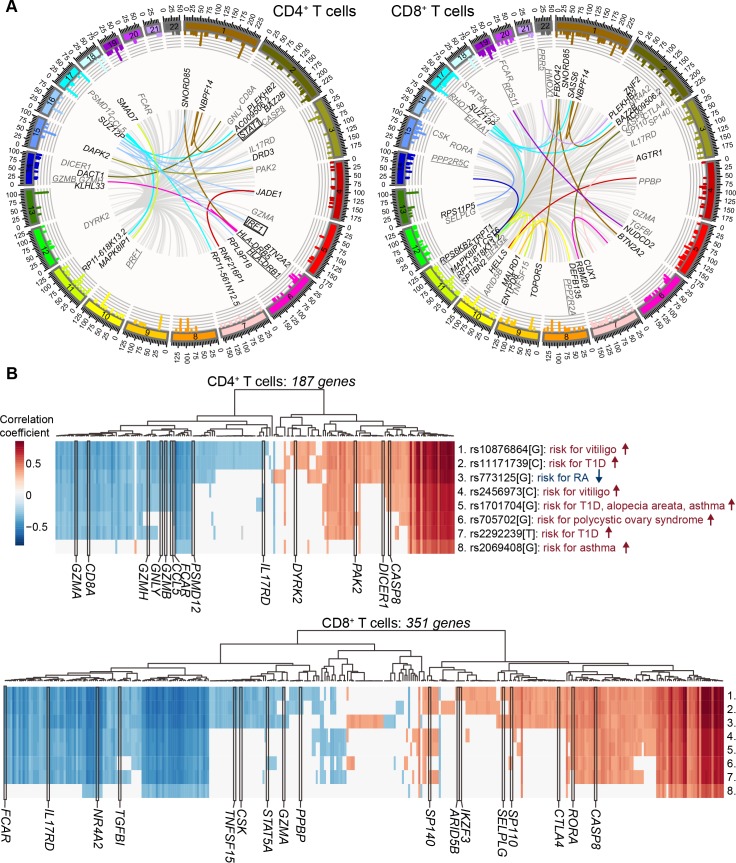
Fig 3. Trans-associations in CD4+ and CD8+ T cells.
(A) The outermost rim of the circos plot shows the histogram of the –log10(P-value) of the associations between known genes and SNPs. Per every significant known gene only the highest –log10(P-value) is depicted. The innermost network represents the trans-associations between the SNPs and the most significant gene expression probes per gene. The lines are colored by the chromosome of the given SNP, except for the locus on chr12q13.2 with over 100 trans-associations that are colored in grey. An arbitrary selection of genes is depicted. All genes not affected by chr12q13.2 SNPs are colored in black and a set of genes affected by chr12q13.2 trans-acting regulatory SNPs are selected based on their known importance in immune system related processes and are colored in grey. The underlined genes are involved in T1D and mTOR signaling in CD4+ T cells and CD8+ T cells, respectively. Two boxed genes among the genes with trans-eQTLs in CD4+ T cells are associated with the T1D susceptibility variant rs4788084 close to the IL27 gene. (B) Heatmap of the correlation coefficients between chr12q13.2 trans-acting regulatory SNP allele dosages and gene expression levels in CD4+ and CD8+ T cells are shown. The most significant gene expression probe per gene is chosen. An arbitrary selection of genes based on their importance in immune system related processes are marked with black borders and gene symbol. The depicted SNPs are linked with their role in disease susceptibility based on GWAS studies [30,33–40] and the numbers indicated in the lower panel refer to the same SNPs listed in the top panel.

