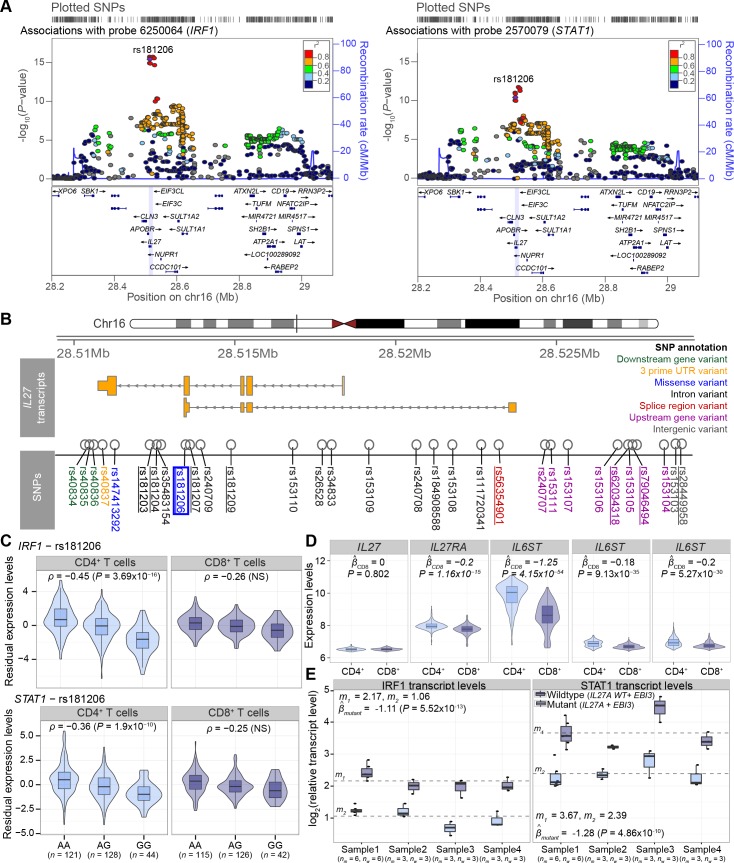
Fig 4. Trans associations with IRF1 and STAT1 gene expression levels in CD4+ T cells.
(A) Regional association plots of the IL27 region SNPs with association P-values for expression levels of IRF1 (chr5) and for STAT1 (chr2) in CD4+ T cells. The missense SNP rs181206 is used as the index SNP for showing LD between the SNPs. (B) Overview of the IL27 transcripts and SNPs located in the IL27 gene region. In addition to the missense SNP rs181206, other SNPs with the lowest association P-values in the upper LD cloud in panel (A) are intronic variants rs181203, rs181204, rs181207, rs181209, splice region variant rs56354901, upstream gene variants rs62034318, rs79046494, and intergenic variant rs28449958. (C) The effect of the missense SNP rs181206 on IRF1 and STAT1 gene expression levels are shown. P-values greater than 9.2x10⁻⁸ in CD8+ T cells resulted in FDR > 0.05 noted as NS (not significant). (D) Expression levels (y-axis, quantile normalized and log2-transformed) grouped by cell type (x-axis) are shown for the three genes: IL27 (probe 6520523 in the last exon), IL27RA gene (probe 4250735 in 3' downstream sequence), and IL6ST gene (probe 4010100 at the end of the last exon, 3830048 at the beginning of the last exon, 4260333 in the middle of the gene, from left to right). Linear mixed effects model is used to estimate the mean of the differences in expression levels between CD4+ and CD8+ T cells. (E) The effect of the mutant and wild-type alleles of rs181206 on the expression levels of IRF1 and STAT1. The log2 relative transcript levels (y-axis) are shown as a boxplot per allele and sample, with four samples in total. Every sample was run in multiple parallel reactions, indicated by nm (number of mutant reactions) and nw (number of wild-type reactions), Sample1 was used in two parallel sets. The mean expression in each class is shown by grey dashed lines, where m1 and m2 are indicating the mean among wild-type and mutant samples, respectively. The effect of the mutant SNP on transcript levels is evaluated by linear mixed effects models. Boxplots within violin plots are depicted as in Fig 1.

