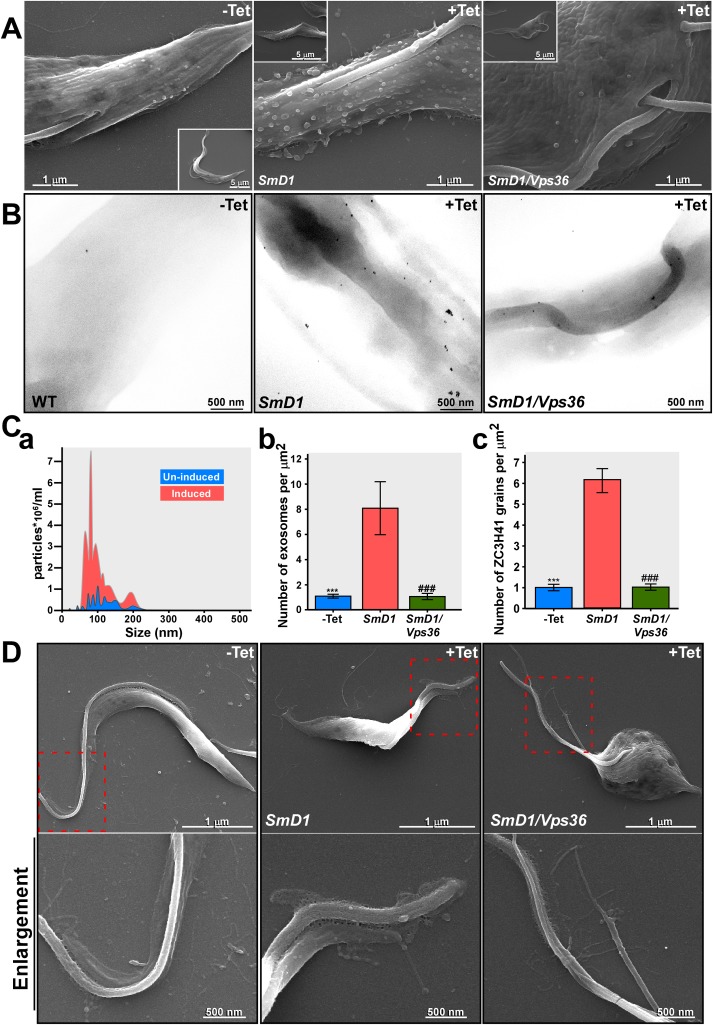
Fig 6. Exosome detection by SEM of SmD1 and SmD1/Vps36 silenced cells.
(A) Cells carrying the SmD1 silencing construct before (-Tet), and after 40 hrs of silencing (+Tet) were fixed and visualized under EM. The scale bars and the cells identity are indicated. (B) SEM immunogold. SmD1 and SmD1/Vps36 silenced cells as describe in A were subjected to immunogold analysis with ZC3H41 antibodies. The scale bars and the cells identity are indicated. (C) Quantitative analysis of secreted exosomes (a) NanoSight analysis. To quantitate the number of exosomes, exosomes were prepared from un-induced cells (109) or after 40 hrs. of induction. The exosomes were analyzed by NanoSight. Un-induced (blue); SmD1 silenced cells (red). (b) Quantitation of exosomes from EM images. The number of exosomes was determined by counting exosomes present in a given surface area. 12 independent images for each of the panels were analyzed. The number of exosomes per μm2 is given. Statistical analysis was performed using one-way ANOVA, post hoc–Bonferroni-test implemented in SPSS (IBM, USA) ***/### P <0.005 compared to +Tet. (c) Quantitation of immunogold analysis with ZC3H41 antibodies. Twenty different images were analyzed. The size of each cell was calculated and the number of grains per μm2 is given. Statistical analysis was performed as described in panel (Cb). (D) High resolution SEM demonstrating nanotubes near the flagellar pocket. Cells (as indicated on the top of each frame) before silencing (-Tet), and after 40 hrs of silencing were visualized by SEM. Higher magnification of the sections is indicated. The scale bars and the cells identity are indicated.

