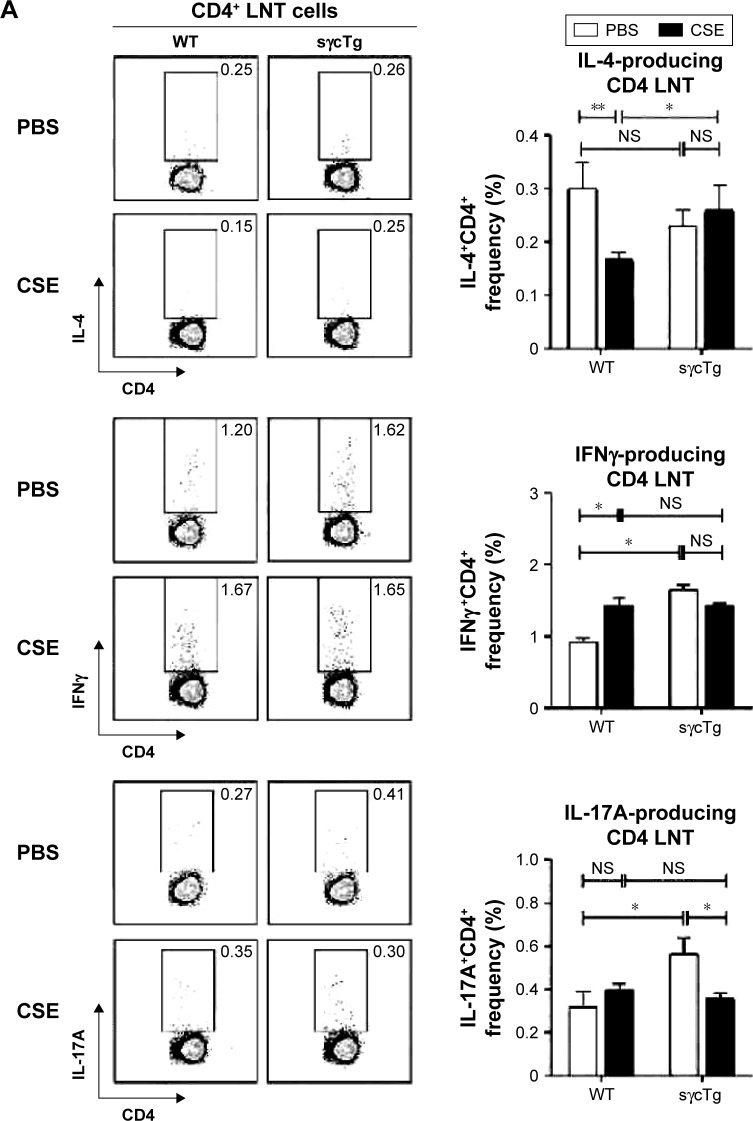
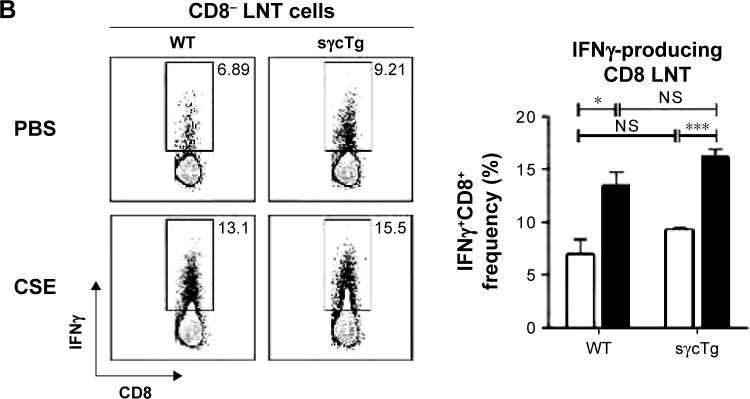
Figure 3.
Cytokine profiles in COPD-induced WT and sγcTg LNT cells.
Notes: (A) CD4 LNT cells from CSE or PBS-treated WT and sγcTg mice were stimulated for 3 h with PMA and ionomycin and assessed for IL-4, IFN-γ, and IL-17A expression by intracellular staining (left). Bar graph shows percent (%) IL-4-, IFN-γ-, or IL-17A-producing CD4 LNT cells (right). Error bars represent the mean and SEM of four to five mice per group. (B) CD8 LNT cells from CSE or PBS-treated WT and sγcTg mice were stimulated for 3 h with PMA and ionomycin and assessed for IFN-γ expression by intracellular staining (left). Bar graph shows percent (%) IFN-γ-producing CD8 LNT cells (right). Error bars represent the mean and SEM of four to five mice per group. *P<0.05, **P<0.01, and ***P<0.001.
Abbreviations: WT, wild type; sγcTg, soluble form of common gamma chain transgenic; LNT, lymph node T; CSE, cigarette smoke extract; PBS, phosphate-buffered saline; SEM, standard error of the mean; NS, not significant; PMA, phorbol 12-myristate 13-acetate.


