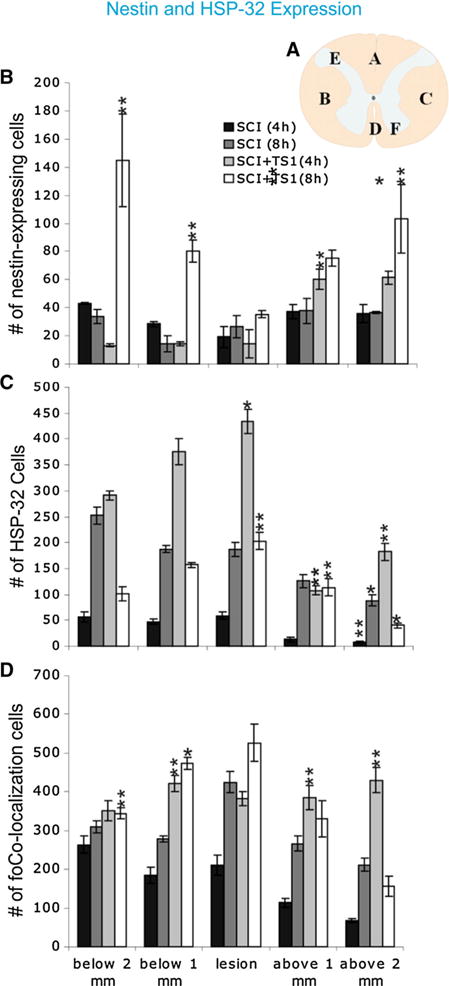
Fig. 2.

TSC1 increased the number of nestin-expressing cells 4 and 8 h after treatment. a Schematic representation of a transverse section of the spinal cord showing the six different areas used to count cells. The bar graph represents the total number of cells from three separate groups that were counted: nestin-GFP expressing cells (b), HSP-32 positive cells (c), and, co-expression of both markers by the same cell (d). Quantification was performed from coronal spinal cord sections of control (SCI) mice and SCI + TSC1 mice. HSP-32 positive cell numbers reached their highest at the level of the lesion and below (caudal to) the lesion after TSC1 treatment. Nestin-GFP expressing cells in SCI mice were increased after been treated with TSC1 for 4 and 8 h. The number of cells co-expressing nestin-GFP and HSP-32 was increased after treatment with TSC1. Note that the total number of nestin or HSP-32 expressing cells would be the sum of the corresponding bars for each marker and the number represented in the colocalization bar. Bars represent the mean ± SD; *p < 0.05, **p < 0.01 versus respective control
