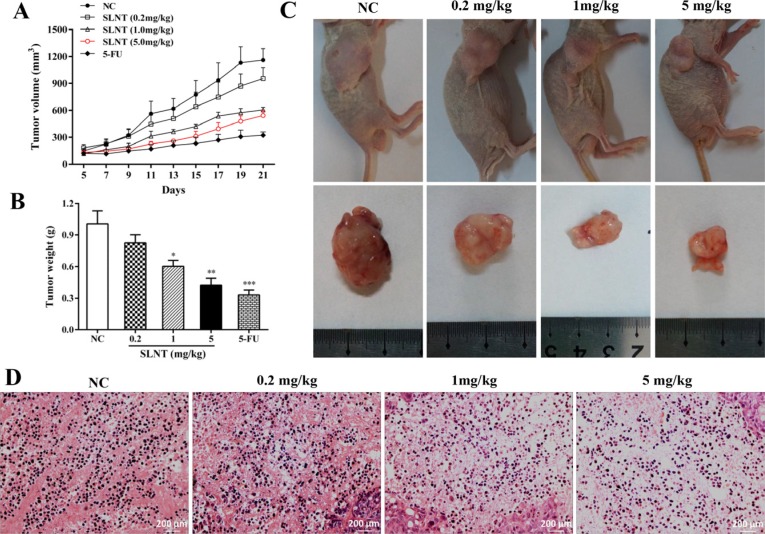
Figure 2. Inhibition and apoptotic induction effect of SLNT on HT-29 xenografts.
Tumor volume from day 5 to day 21 (A) and tumor weights at the end of treatments were measured (B) Columns, mean ± SD (n = 6); *p < 0.05, **p < 0.01, ***p < 0.001 versus NC group. Photographs of nude mice and tumors of each group were taken at end of experiment (C) Representative histopathological changes of apoptosis in tumors were analyzed by H&E staining (400×, D).

