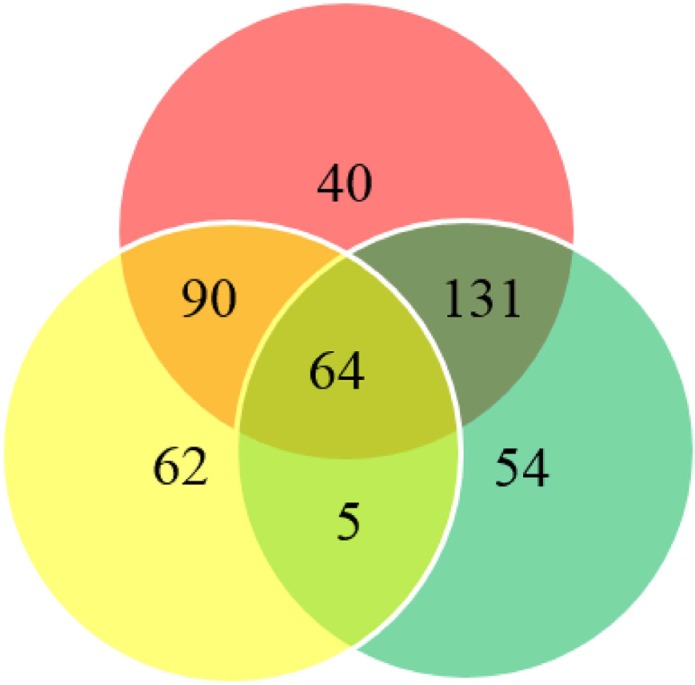
Figure 2. Venn diagram summarizing the differentially methylated sites.
Red circle indicates differentially methylated sites between cancer and healthy control tissues; yellow circle indicates differentially methylated sites between cancer and remote normal-appearing tissue; green circle indicates differentially methylated sites between remote normal-appearing and healthy control tissues.

