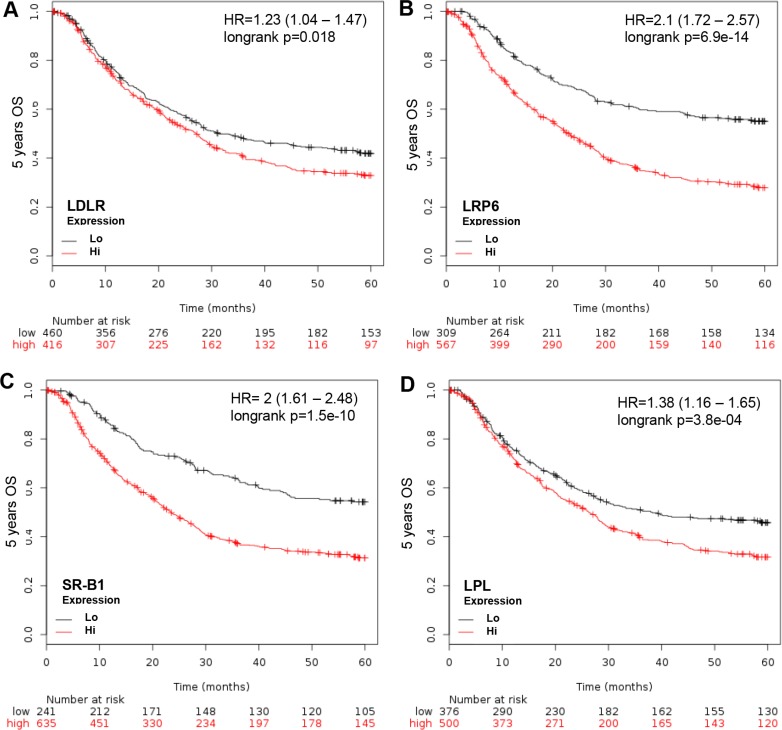
Figure 2. KM plotter evaluation of L/R route, including LDLR, LRP6, SR-B1 and LPL in GCa 5-year OS.
(A) LDLR expression status in GCa patients. Red line indicates high expression and the black line indicates low expression. The 0 month patient number with high LDLR is 416, and low LDLR is 460. The last 60-month patient number with high LDLR is 97, and low LDLR is 153. The HR is 1.23 (range 1.04–1.47), and p-value is 0.018. (B) LRP6 expression status in GCa patients. The 0 month patient number with high LRP6 is 567, and low LRP6 is 309. The 60-month patient number with high LRP6 is 116, and low LRP6 is 134. The HR is 2.1 (range 1.72–2.57), and p-value is 6.9e-14. (C) SR-B1 expression status in GCa patients. The 0 month patient number with high SR-B1 is 639, and low SR-B1 is 241. The 60-month patient number with high SR-B1 is 145, and low SR-B1 is 105. The HR is 2 (range 1.61–2.48), and p-value is 1.5e-10. (D) LPL expression status in GCa patients. The 0 month patient number with high LPL is 500, and low LPL is 376. The 60-month patient number with high LPL is 120, and low LPL is 130. The HR is 1.38 (range 1.16–1.65), and p-value is 3.8e-04.

