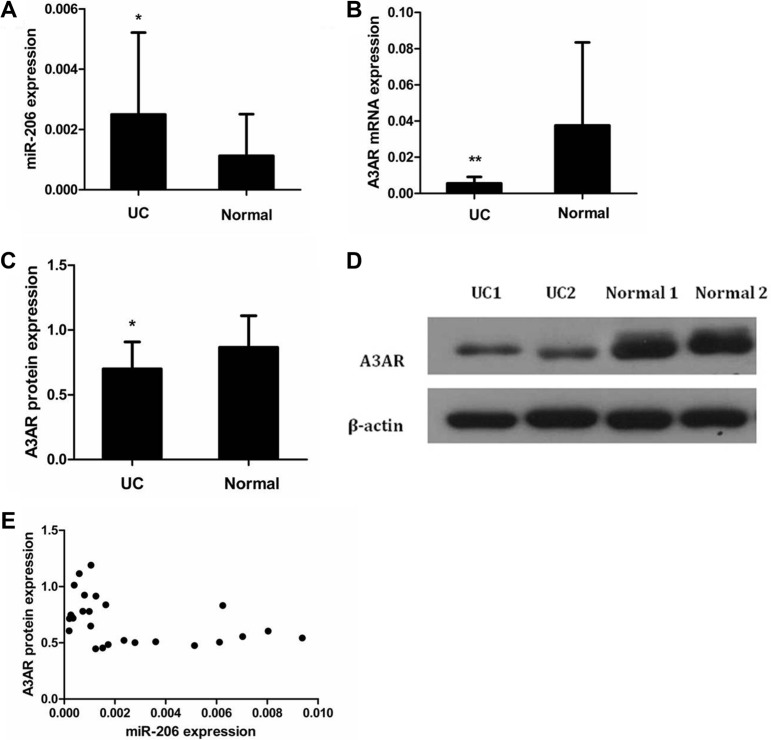
Figure 1. Expression and correlation of miR-206 and A3AR in UC tissues.
Expression in UC and normal tissues of (A) miR-206, (B) A3AR mRNA, and (C) A3AR protein. (D) Representative western blotting showing A3AR protein expression in UC and normal tissues. Data are presented as means ± SD of 3 independent experiments. *P < 0.05; **P < 0.01. (E) Correlation of miR-206 and A3AR expression (Pearson correlation r = −0.404, P < 0.05).

