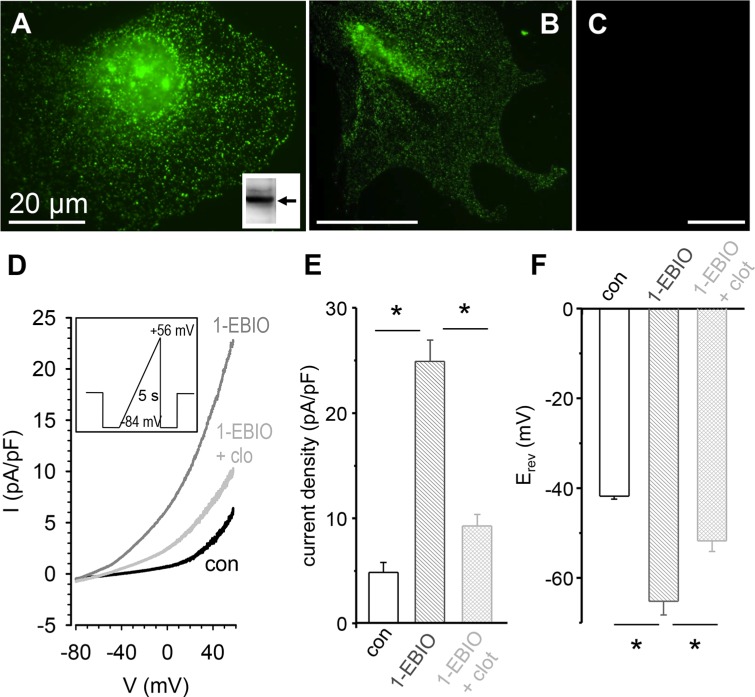
Figure 1. Expression of KCa3.1 in RLT-PSCs.
(A, B) Immunofluorescence and Western blot. Staining of KCa3.1 channels in RLT-PSCs (A) and primary murine PSCs (B) by indirect immunofluorescence reveals the typical punctate pattern. Inset: Western blot analysis yields a band of the expected size (~50 kD). (C) KCa3.1 channels are not detected in PSCs from KCa3.1−/− mice. (D) Original recording of a patch clamp experiment in the whole-cell configuration. The holding potential was −40 mV. We applied a voltage ramp of 5 s duration from −84 mV + 56 mV. The KCa3.1 channel activator 1-EBIO (50 μmol/l) produced a large outward current which was inhibited by clotrimazole (1 μmol/l). (E, F) Summary of the patch clamp experiments. The current densities (pA/pF) are plotted in E., and F. depicts the reversal potentials (n = 9). * denotes p ≤ 0.05.

