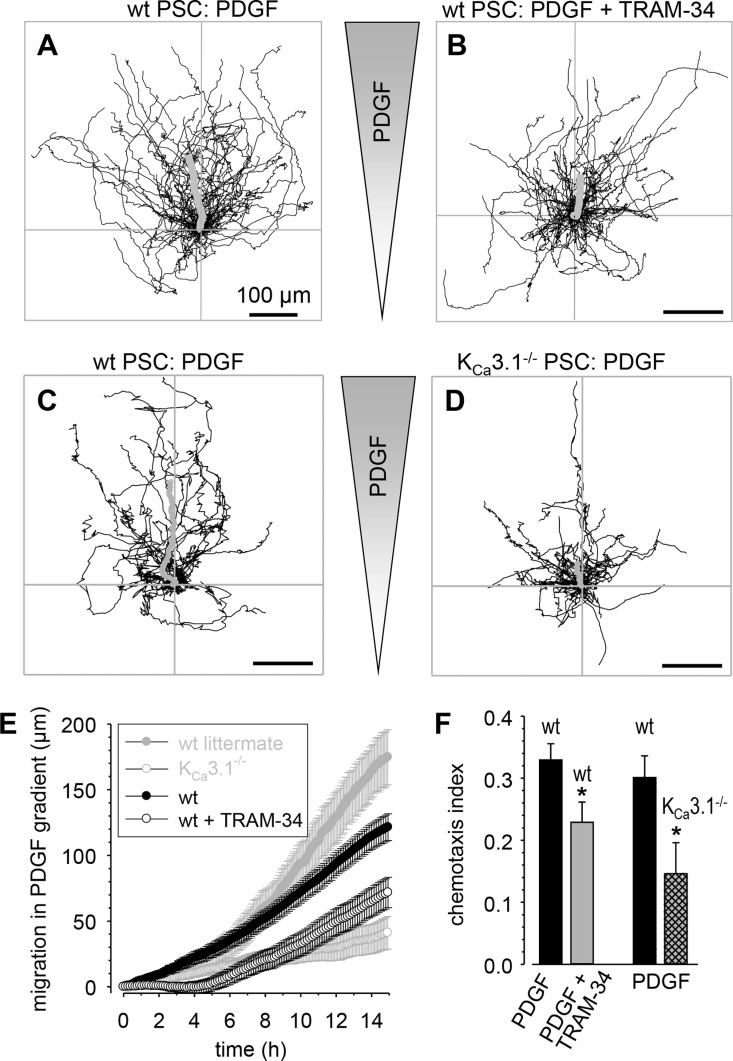
Figure 3. Chemotaxis of primary murine stellate cells towards PDGF is attenuated by KCa3.1 channel inhibition.
(A–D) Trajectories of individual PSCs normalized to common starting points. The grey shaded triangle indicates the chemotactic PDGF gradient with an increasing concentration towards the top. The bold grey lines represent the average movement of the entire cell populations. (A, B) PSCs from wt mice in the absence and presence of the KCa3.1 channel blocker TRAM-34. (C, D) PSCs from wt mice and their KCa3.1−/− littermates. (E) Net movement into the direction of the chemotactic gradient. KCa3.1 channel blockade and KCa3.1 knock-out lead to a delay and an attenuation of the chemotactic movement. (F) Summary of the chemotactic indices of the experiments shown in (A–D) The left bars compare the mean chemotactic index of wt PSCs in the absence and presence of the KCa3.1 channel inhibitor TRAM-34. The right columns summarize the experiments with KCa3.1−/− PSCs compared with the respective wt littermates. n = 22–43 cells from N = 3–4 mice.

