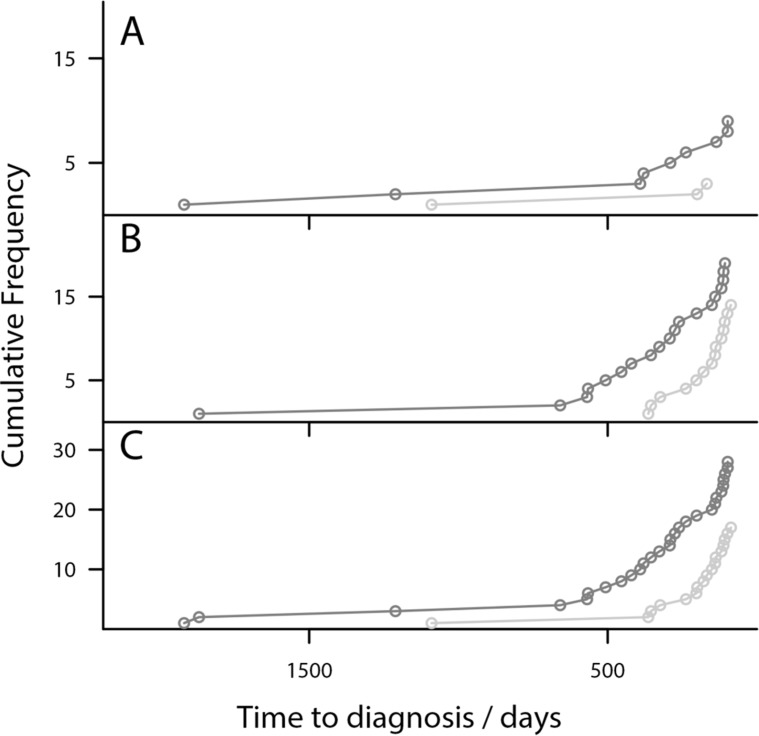
Figure 5. Risk Models detect OC earlier than CA125 in triage algorithm- Plot of the cumulative diagnosis of OC cases using the triage algorithm.
(A) Type I cases only (grey), (B) Type II cases only (grey) and (C) Combined OC cases (grey), plotted against the CA125 > 35 U/mL clinical threshold (light grey). For Type I cases the algorithm identifies many more samples at much earlier time points. For Type II cases the algorithm also detects OC cases much earlier than the CA125 threshold. The patterns continue for combined OC.

