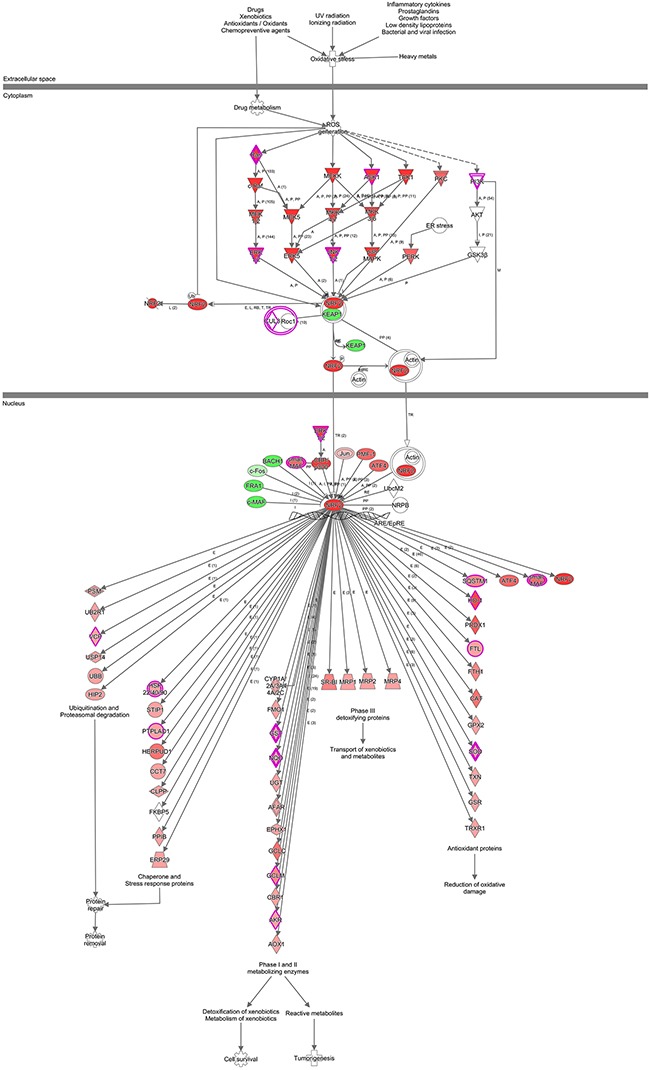
Figure 12. IPA identified proteins networks showing inter-relationships and pathways.

A sub-network of proteins with different expression and altered pathway was demonstrated. Green fields indicated down-regulated and the red fields indicated up-regulated proteins. For protein network or pathways analysis, statistical significance was determined with Fisher's exact test (P < 0.05).
