. 2017 Mar 15;6:e20488. doi: 10.7554/eLife.20488

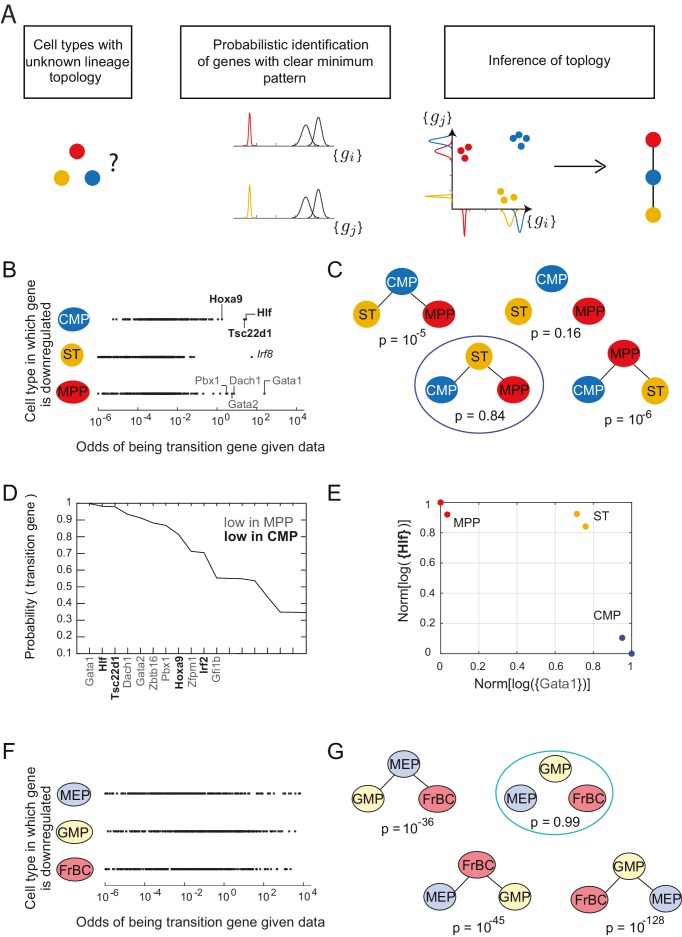
Figure 2. Identification of topology and transition genes (showing clear minimum pattern) for each triplet of cell types.

(A) Schematic for the statistical inference of lineage topology for 3 cell types. Genes with a clear minimum pattern indicate which cell types that are not the root (see Figure 1C) and hence allow inference of the topological relationship. (B) Dot plot (each dot representing a gene) of the cell type that is most likely to have the minimum mean expression of each gene among CMP, ST and MPP as a function of the odds 𝒪i of that gene being a transition gene. Each gene votes against the topology whose root has the minimum mean among the three cell types, and this vote is weighted by the odds that the gene is a transition gene (Equation 1). Two groups of genes, labeled by their names, have high odds of being transition genes and thus cast a strong vote against CMP or MPP being the root.(C) The computed probability of the topology given gene expression data indicates 0.84 probability that ST is the intermediate type.(D) The plot of the probabilities of genes being transition genes for triplet ST/MPP/CMP, given gene expression data and that the topology is MPP – ST – CMP. The names of the 10 genes with the highest probability of being transition genes are shown. Probabilities are calculated assuming the prior odds p(βi=1)p(βi=0) = 0.05 (see main text). There are two classes of transition genes: one for which gene expression in CMP is greater than expression in MPP (regular font), and another for which gene expression in MPP is greater than expression in CMP (bold font).(E) Plot of the replicates of ST, MPP and CMP in the gene-expression space of the two classes of transition genes (with probability > 0.8). Plotted on each axis is the mean normalized log expression level of the transition genes in the class, each class is denoted in curly brackets by the name of the transition gene with the highest probability.(F) Dot plot for triplet MEP/GMP/FrBC of the cell type that is most likely to have the minimum mean expression as a function of the odds Oi of that gene being a transition gene.(G) The computed probability of the topology given gene expression data is the null hypothesis (p=0.99).

DOI: http://dx.doi.org/10.7554/eLife.20488.008

Figure 2—source data 1. Early hematopoietic cell types considered.
Listed for each early hematopoietic progenitor whose name is abbreviated in this paper are the Immunological Genome Project descriptor for the cell type, its common name and phenotype, its age and location, and the number of replicates in the data set.
DOI: 10.7554/eLife.20488.009
Figure 2—source data 2. Probabilities of topologies for triplets of hematopoietic cell types.
Listed are, for each triplet of cell types, the probabilities of the four topologies for prior odds p(βi=1)p(βi=0)=0.05; the number of topologies that reach probability p(T | {giA,B,C})>0.6 for some value of p(βi=1)p(βi=0)  between 10−6 and 102; the non-null topology that has the highest probability p(T | {giA,B,C}) over the range of prior odds (if the null topology is the most likely topology for the entire range of prior odds, the topology is marked ‘null’); and the value of highest probability p(T | {giA,B,C}) over the range of prior odds; the correct topology and triplet length in the traditional model; and the correct topology and triplet length in the Adolfsson model.
DOI: 10.7554/eLife.20488.010
Figure 2—source data 3. Probabilities of transition and marker genes for the hematopoietic lineage tree.
Listed are, for crucial triplets along the lineage tree, the 200 genes with the highest probabilities of belonging to the two transition gene classes and the root marker class, and their associated probabilities.
DOI: 10.7554/eLife.20488.011

Figure 2.

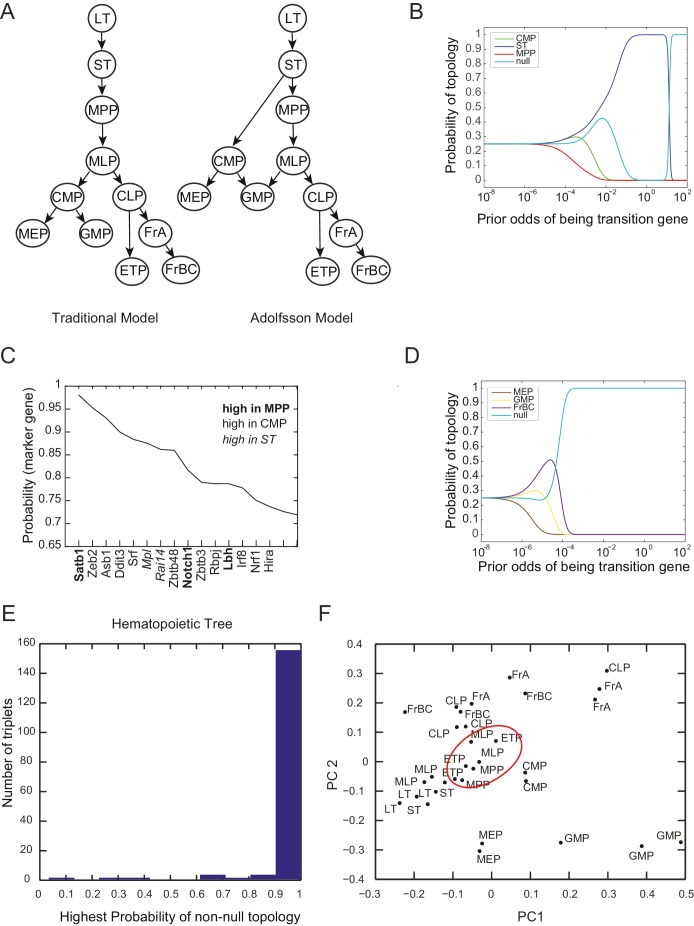
Figure 2—figure supplement 1. Probability of topology depends on prior odds.

Figure 2—figure supplement 1.

(A) Two models of the hierarchy of early hematopoietic progenitors, both built based on prospective isolation of lineage restricted progenitors, include (left) the traditional model, in which the first split strictly separates myeloid and lymphoid lineages (Akashi et al., 2000; Kondo et al., 1997; Reya et al., 2001) and (right) an alternative hierarchy proposed by Adolfsson and colleagues, in which lymphoid progenitors subsequent to the first split retain some myeloid potential (Adolfsson et al., 2005). (B) The inferred probability of different topological configurations as a function of the prior odds of genes being transition genes. At low values of the prior odds, very few genes are given substantial votes in the inference procedure. The topology MPP-ST-CMP has high probability for a range of prior odds. (C) Genes with high probability of being marker genes for MPP (bold), CMP (plaintext), or ST (italics). (D) The triplet MEP, GMP, FrBC shows no significant probability of a non-null topology for a wide range of prior odds. In this case, our inference method makes no claim as to the topological configuration based on the gene expression evidence provided. (E) Histogram of the maximum inferred probability of a non-null topology for the 165 triplets of hematopoietic progenitors. (F) Projections of the early hematopoietic progenitors along first two principal components. (PC1: 30%; PC2: 17%). Each point represents a different replicate. Note the proximity between ETP and MPP samples (red circle), which does not reflect either of the lineage models shown in (A).
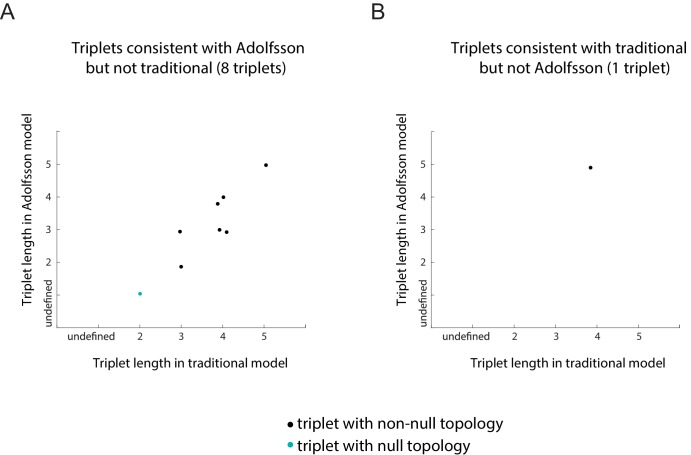
Figure 2—figure supplement 2. Plots of the length of the triplets distinguishing the traditional model and in the Adolfsson model.

Figure 2—figure supplement 2.

Separate plots are shown for triplets whose inferred topology is consistent with only the Adolfsson model (A) and the traditional model (B) Triplets whose inferred topology is null are shown in turquoise; those whose inferred topology is non-null are shown in black. Jitter was added to the points for clarity.