. 2017 Mar 15;6:e20488. doi: 10.7554/eLife.20488

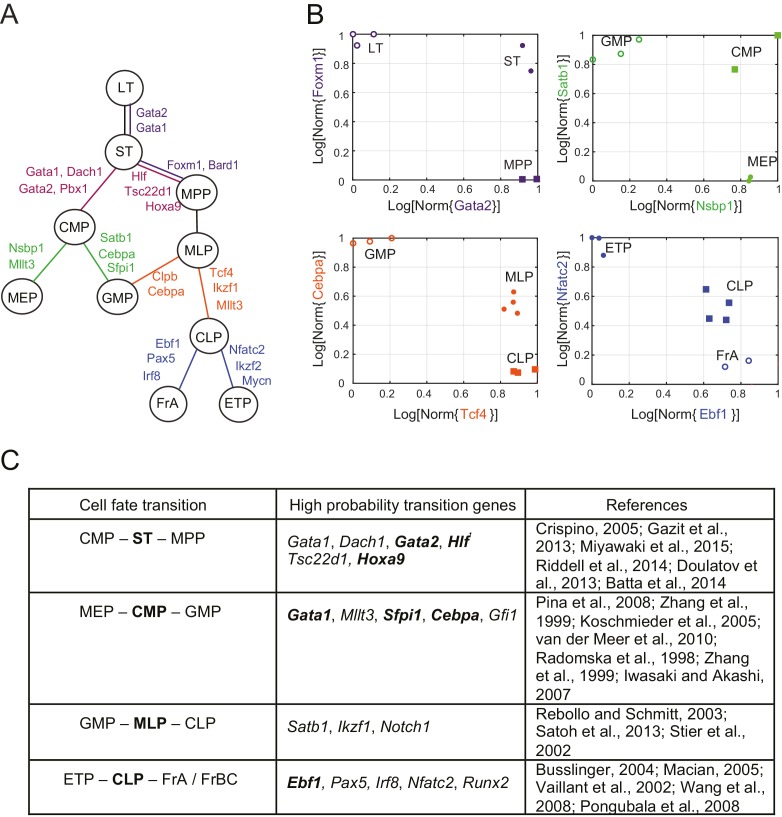
Figure 3. Reconstruction of lineage tree and key transition gene for early hematopoiesis.

(A) Final lineage tree, recapitulating the inferred triplet topologies, with top inferred transition genes indicated along cell fate decisions. (B) Plot of the replicates of different cell types in the gene-expression space of the transition gene classes (probability > 0.8) for 4 cell-fate transitions along the inferred lineage tree in (A). Plotted on each axis is the mean normalized log expression level of the transition genes in the class. The axis labels and data points are color-coded according to the colors in (A). (C) Table with selected transition genes for early hematopoietic cell-fate transitions, along with references to published validations of their functional role. Genes known to be effective for reprogramming are shown in bold.

DOI: http://dx.doi.org/10.7554/eLife.20488.014

Figure 3—source data 1. Marker genes for early hematopoiesis.
Table with selected marker genes for early hematopoietic cell types, along with references to published validations of their functional role. Genes known to be effective for reprogramming are shown in bold.
DOI: 10.7554/eLife.20488.015

Figure 3.

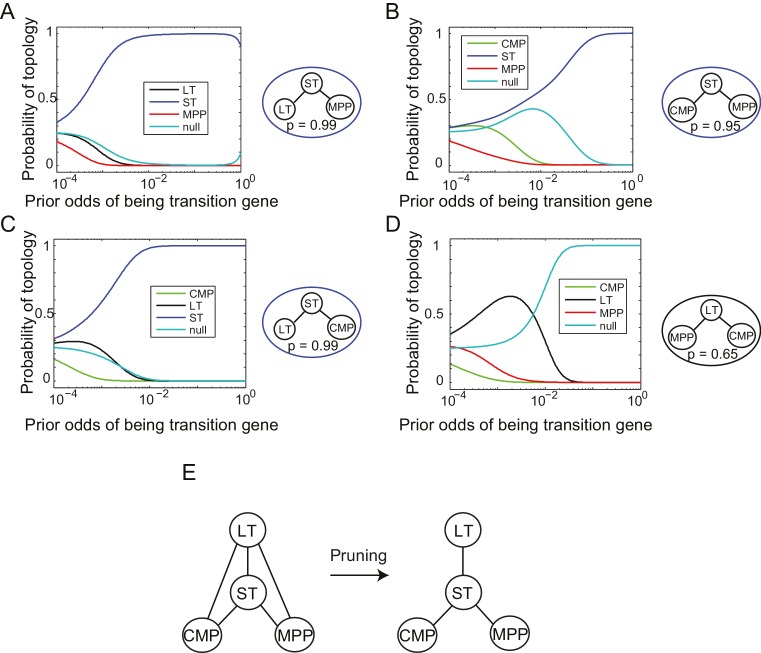
Figure 3—figure supplement 1. Reconstruction of lineage tree from individual triplets.

Figure 3—figure supplement 1.

(A–D) Probability of all topological configurations for a triplet as a function of prior odds for all triplets between 4 cell types: MPP, ST, LT, and CMP. (A) The LT-ST-MPP triplet, with p=0.99. (B) The CMP-ST-MPP triplet, with p=0.95. (C) The LT-ST-CMP triplet, with p=0.99. (D) The MPP-LT-CMP triplet, with p=0.65. Note that the next highest topology here is the null topology. (E) These four triplets can be combined to infer a simple relationship between all four cell types that is consistent with the topological restrictions inferred from each high probability triplet.
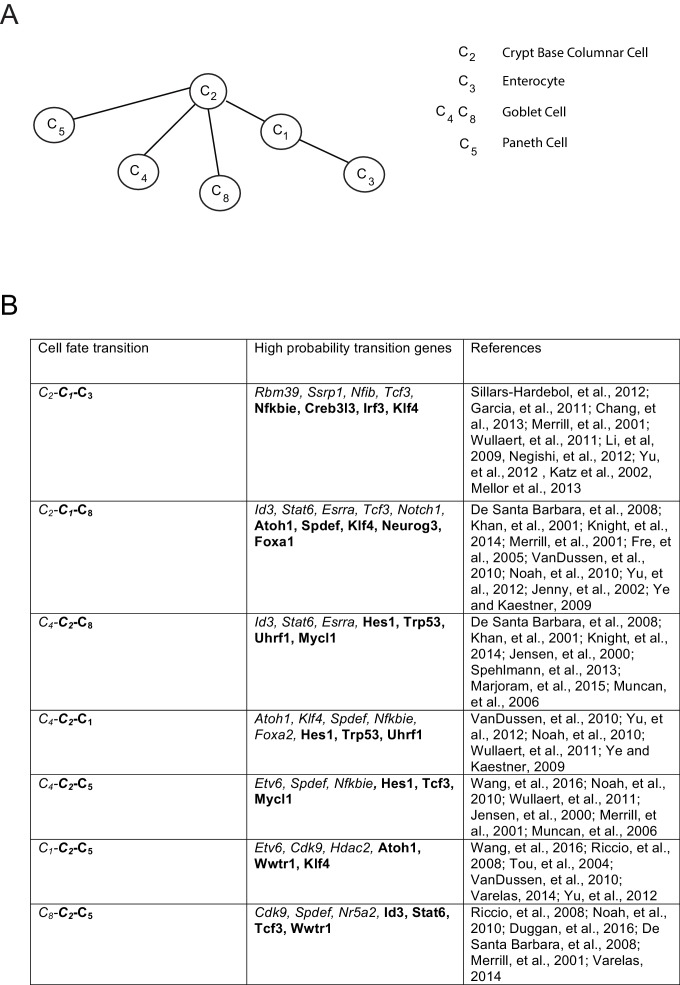
Figure 3—figure supplement 2. Inferred lineage tree and transition genes for intestinal development.

Figure 3—figure supplement 2.

(A) Inferred lineage tree from intestinal single cell data taken from (Grün et al., 2015).Cluster identifications were taken from RaceID2 (Grün et al., 2016), and a similar tree was inferred from StemID ([Grün et al., 2016], not shown). Using 1369 transcription factors, we inferred these lineage relationships between all cell clusters with more than 10 cells per cluster. The tree differs from that in (Grün et al., 2016) only in the progression from C2 – C8 – C4, while we infer the triplet C8 – C2 – C4 with p>0.99, both of which are consistent with literature (van der Flier and Clevers, 2009), and await experimental validation. (B) High-probability transition genes with known relevance in intestinal homeostasis or differentiation taken from the top 20 transition genes for each lineage progression.