. 2017 Mar 15;6:e20488. doi: 10.7554/eLife.20488

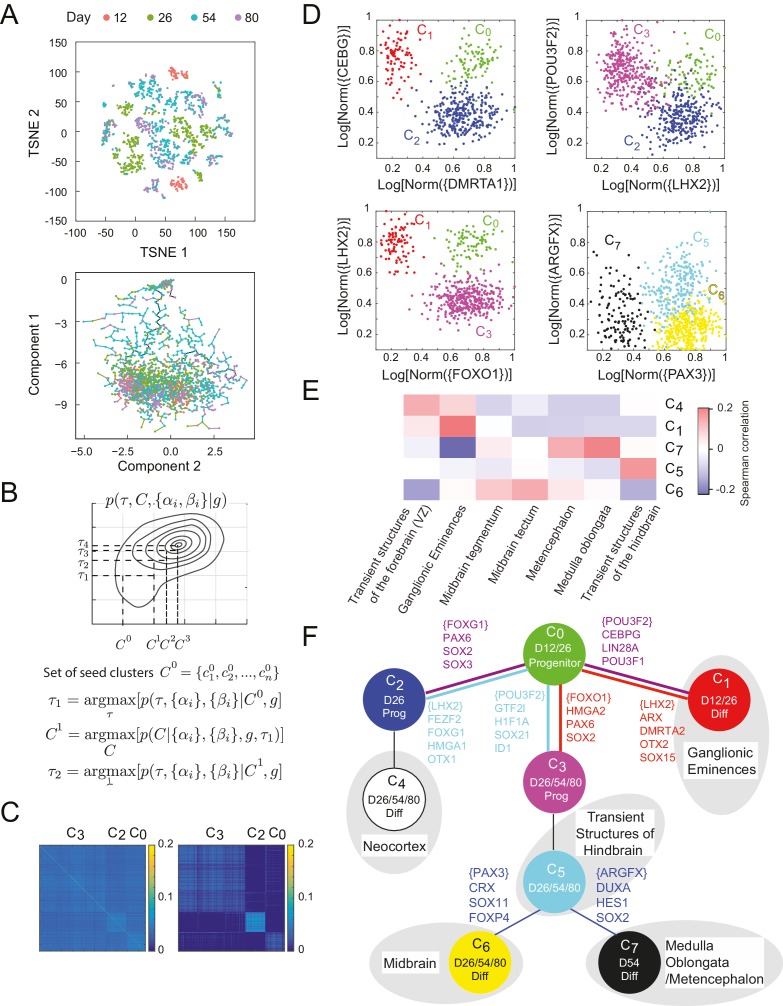
Figure 4. Inference of lineage tree and key transitions genes using single cell expression data from in vitro differentiated developing human brain. .

(A) RNA-seq data from single cells collected at days 12, 26, 54, and 80 from a human brain in vitro differentiation protocol (Yao et al., 2017) were analyzed using a variety of existing methods. Partitioning single-cells into cell types through non-linear dimensionality reduction using t-SNE (top) depends on the perplexity parameter (set here to 5, see Figure 4 – Figure Supplement 1A-B) and does not allow for mechanistic understanding. Independent component analysis of all transcription factors with Monocle (bottom) does not show clear structure and could not inform reconstruction of lineage relationships. (B) Maximization algorithm to determine most likely cluster identities {C}{c1,c2,,cn}, sets of transitions {T}, marker genes (αi=1) and transition genes (βi=1), given single-cell gene expression data {gi}. Starting from a seed clustering scheme {C0}, iterative maximization of the conditional probabilities p({T},{αi},{βi}|{gi},{C}) and p({C}|{gi},{T},{αi},{βi}) converges to most likely set ({C},{T},{αi},{βi}) (C) Cell-cell covariance matrix between cells using only the associated high probability marker and transition genes show the final cluster assignments c0, c2 and  c3 (right) in contrast to using all transcription factors (left). (D) Selected high probability triplets of clusters plotted in the axes defined by two sets of transition gene classes for each triplet. c1 c0 c2 (top right, p(T=c0 | {gic0,c1,c2})> 0.99), plotted in transition gene class {CEBPG} also including POU3F1, POU3F2, NR2F1, NR2F2, ARX, LIN28A, TOX3, ZBTB20, PROX1 and SOX15, and class {DMRTA1} also including HES1, HES5, FOXG1, PAX6, HMGA2, SOX2, SOX3, SOX9, SOX6, SP8, OTX2, TGIF, ID4, TCF7L2, and TCFL1.  c2 c0 c3 (top left, p(T=c0 | {gic0,c2,c3})= 0.96), plotted in transition gene class {LHX2} also including FEZF2, FOXG1, HMGA1, SP8, OTX1, SOX11, GLI3, SIX3, ETV5, and class {POU3F2} also including GTF2I, HIF1A, ID1, ID3, PROX1, SALL1, SOX21, TCF12, TRPS1, ZHX2. c1 c0 c3 (bottom left, p(T=c0 | {gic0,c1,c3})>0.99), plotted in transition gene class {FOXO1} also including HMGA2, PAX6, and SOX2, and class {LHX2} also including DMRTA2, HMGA1, ARX, LIN28A, OTX2, LITAF, NANOG, POU3F1, SOX15. c6 c5 c7 (bottom right, p(T=c5 | {gic5,c6,c7})>0.99), plotted in transition gene class {PAX3} also including CRX, SOX11, EBF2, FOXP4, ASCL1, FOXO3, and SIX3, and class {ARGFX} also including DUXA, HES1, NFIB, PPARA, SOX2, SOX7, and SOX9. (E) Correlations between differentiated cell clusters (Figure 4 – Figure Supplement 4D) and bulk population samples from brain regions (in vivo developmental human data) (Miller et al., 2014). Neuronal cell types can be identified with specific spatial regions of the brain to interpret the topology of the lineage tree. Expression signatures of SOX2+ cell types c0, c2 and  c3 were dominated by pluripotency factors, and are not shown. (F) Inferred lineage tree for brain development. Genes associated with neocortical development, and mid-/hind-brain progenitors, and specific neuronal cell types are identified as high probability transition genes and are corroborated by mapping information from in vivo data. Clusters color-coded similarly to (D). D12/26/54/80 labels indicate time of collection of cells within each cell type. Prog refers to SOX2+ cells, Diff refers to SOX2-/DCX+ cells (Figure 4—figure supplement 1C–D).

DOI: http://dx.doi.org/10.7554/eLife.20488.019

Figure 4—source data 1. Final cluster identities of single cells from in vitro cortical differentiation.
Cells were assigned to a cluster based on an iterative clustering procedure. Their final cluster assignments are shown here. Cell types 8–11 contained bulk brain control cells, and non-neuronal cells which were excluded from the analysis.
DOI: 10.7554/eLife.20488.020
Figure 4—source data 2. Probabilities of topologies for triplets of single-cell clusters.
Listed are, for each triplet of clusters, the probability of a given topology and the root of the inferred topology. ‘0’ refers to the null topology. Triplets with p>0.6 were used to construct the lineage tree.
DOI: 10.7554/eLife.20488.021
Figure 4—source data 3. Probabilities of Transition and Marker Genes for the Human Brain Developmental Lineage Tree.
Listed are, for crucial triplets along the lineage tree, the genes with the p>0.8 of belonging to the two transition gene classes and the root marker class, and their associated probabilities.
DOI: 10.7554/eLife.20488.022
Figure 4—source data 4. Human Brain Development SmartSeq2 Census.
Further detail can be found Materials and methods and in Yao et al. (2017) (Supplemental Information).
DOI: 10.7554/eLife.20488.023
Figure 4—source data 5. List of Human Transcription Factors.
List of human transcription factors used to cluster and infer lineages for the cortical differentiation tree. List was adapted from (Ben-Porath et al., 2008).
DOI: 10.7554/eLife.20488.024

Figure 4.

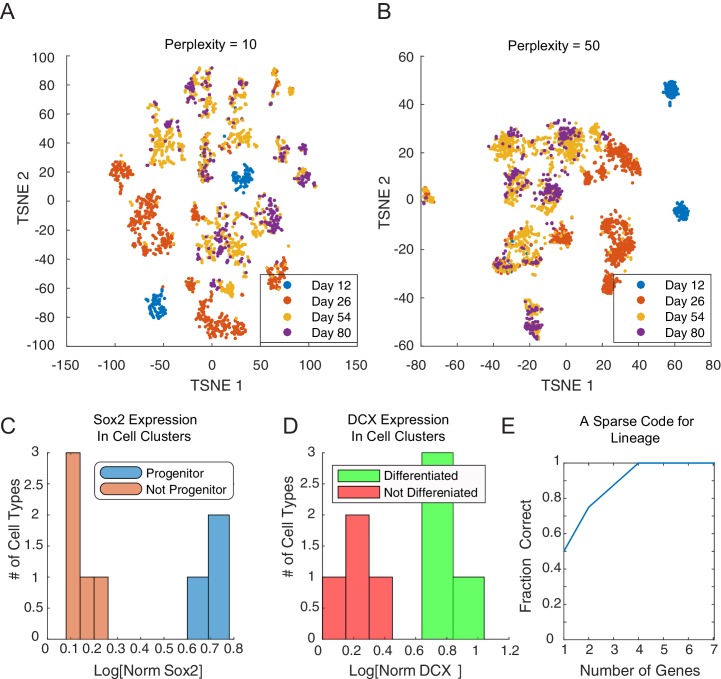
Figure 4—figure supplement 1. Cluster identity and sparse coding in neuronal differentiation.

Figure 4—figure supplement 1.

(AB) t-SNE of developing neuronal cells displays seemingly different number of cell types depending on the perplexity parameter.(C) SOX2 expression clearly falls into bimodal distribution. Cell types with high levels of SOX2 (blue, c0,c2,  and c3) are labeled progenitor cell populations. (D) DCX expression in final clusters is also bimodal, and cell types with high expression (green, c1,c4, c6, and c7) are labeled differentiated (post-mitotic) neurons. (E) We assembled 20 triplets that were inferred to be non-null, and had a maximal distance between leaf nodes of less than 5. Amongst these triplets, we attempted to infer the correct topology using a minimal subset of genes. Restricting the inference to the N genes per triplet with the greatest odds ratio of being transition genes, the tree can be reconstructed accurately for any N ≥ 4.
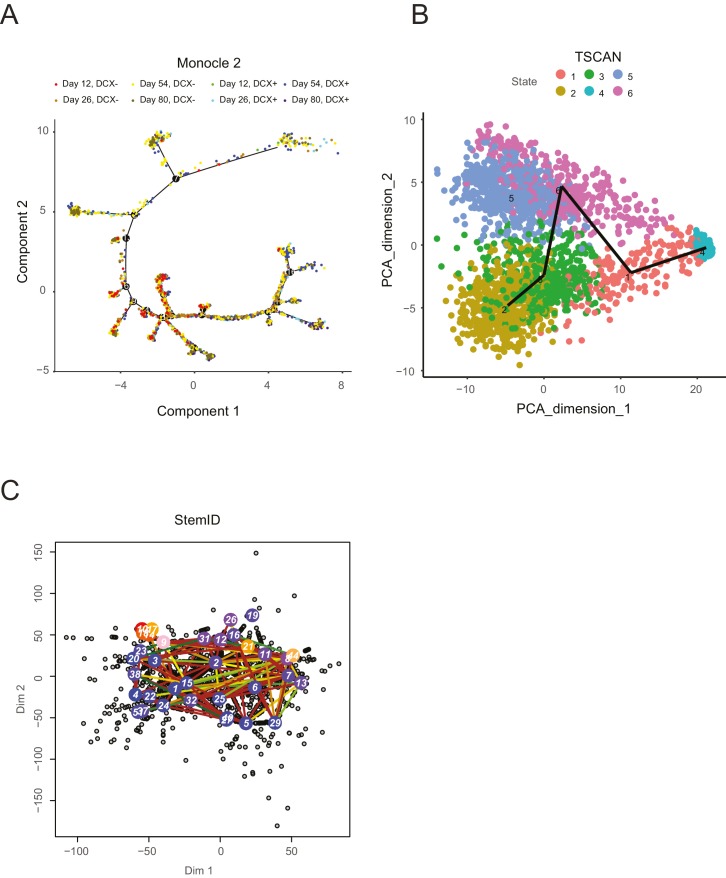
Figure 4—figure supplement 2. A selection of recent lineage-determination methods for single cell transcriptomic analysis applied to an in vitro neuronal differentiation data set (Yao et al., 2017).

Figure 4—figure supplement 2.

Each of these methods was run with multiple sets of parameters in an attempt to optimize the lineage inference; however, it is possible that an unexplored parameter regime might yield more interpretable results, although it is unclear which parameters these might be. (A) Monocle2 (Trapnell et al., 2014) shows a complex tree with clear progression and multiple branches, but does not separate progenitor cells (DCX- cells) from neurons (DCX+ cells): progenitor cells are known to give rise to neurons, whereas neurons are post-mitotic and do not give rise to progenitors, in contradiction with certain portions of the tree. In addition, portions of the tree are in conflict with the general time point information specifying when cells were collected (Yao et al., 2017). (B) TSCAN (Ji and Ji, 2016) shows separation of DCX- and DCX+ cells along PC dimension 2 (note that cells are not labeled by DCX expression in this plot), but fails to capture structure among the differentiated neurons, particularly a fore-/hind-brain split. (C). StemID (Grün et al., 2016) produces a complex lineage that is not directly interpretable, and no clear separation of progenitors from neurons or forebrain-like from mid/hindbrain-like neurons is apparent.