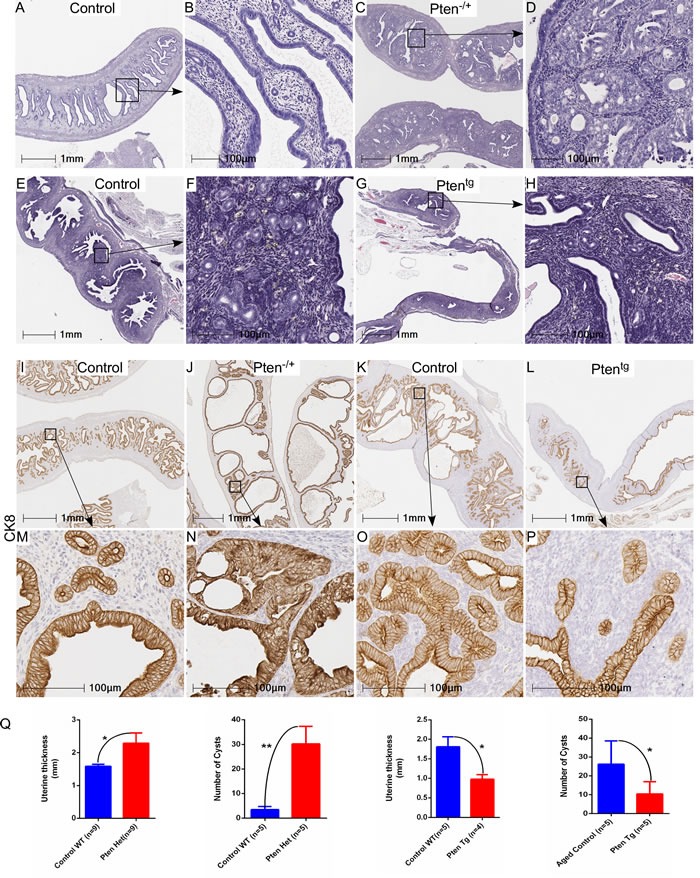
Figure 3. Genetic alterations in Pten, a negative regulator of mTOR signaling, contribute to the hyperplastic growth of uterus.

Haematoxylin and eosin-stained sections of age-matched control and Pten+/− uteri A.-D. B and D represent higher magnification images of boxed areas in panel A and C, respectively. Abnormal hyperplastic growth was observed in aged control uteri, which was not present in age matched Ptentg uteri E.-H. Boxed areas in panel E and G are presented at higher magnification in panel F and G, respectively. CK8, a marker for epithelial cells, staining in control I. and M. Pten+/− J. and N., aged uteri K. and O. and Ptentg uteri L. and P. M, N, O, and P represent higher magnification images of boxed areas in I, J, K and L, respectively. Q. Graphs showing quantification of uterine thickness and number of cysts in Pten+/− and PtenTg mice as compared to their respective controls. *P < 0.05, **P < 0.01, Student's t-test.
