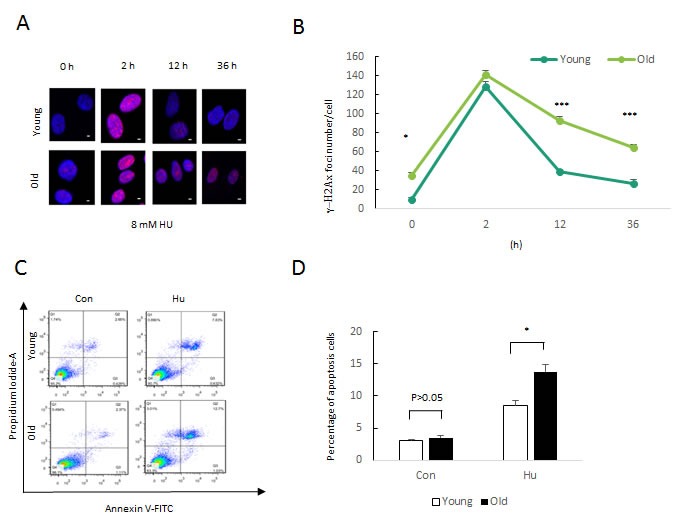
Figure 5. Phenotypic and molecular characterization of 8mM HU-treated DFSCs between Young and Old.

a. Formation of DNA double-strand breaks in DFSCs post HU treatment. DFSCs were treated with 0.5, 8 and 20mM HU for for 2 or 12 h and and allowed to recover until 36 h post treatment. Cells were fixed and stained for γH2AX foci (red) at the indicated time points post HU treatment. Scale bar: 5 mm. b. Graphical depiction of the number of γH2AX foci in DFSCs treated with 0.5, 8 and 20mM HU over 36 h. Data are expressed as mean±S.E. from three independent experiments. *P < 0.05, **P < 0.01, two-way ANOVA with Fisher's post hoc test. c. DFSC cells were treated with 8 mM HU for 48 h and examined by flow cytometry using Annexin-V/PI staining to label apoptotic cells. d. FACS analysis and percentages of apoptotic cells are presented as mean of percentage±S.E. .
