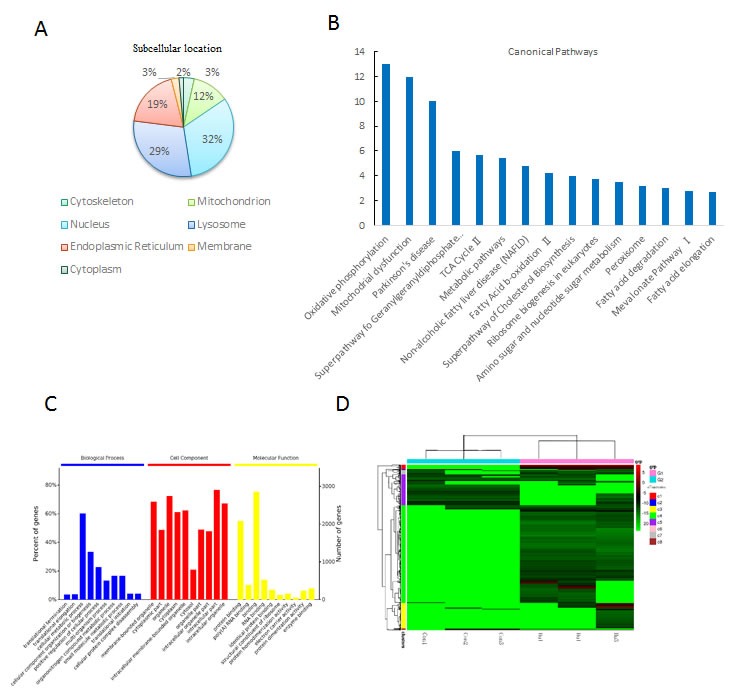
Figure 6. Biological function analysis of the differentially expressed proteins post HU treatment.

a. The cellular component annotations of differentially expressed proteins with GO analysis from DAVID database. b. Top canonical pathways altered post HU treatment with mitochondrial dysfunction being the most significant one. c. GO annotation of identified age-related proteins in three categories: biological process (BP), cellular component (CC) and molecular function (MF). d. Heat map visualization of significantly regulated probe sets. A hierarchical clustering was analyzed on the probe sets and gene transcripts were selected from 6 chips in 2 arrays (Con and HU treatment) through a filter criteria of at least 2-fold changes with P≤0.05 (F test). Columns: samples; rows: genes; color key indicates gene expression value, green: lowest, red: highest.
