
Figure 5. The structures of femoral head and neck at the proximal femurs.
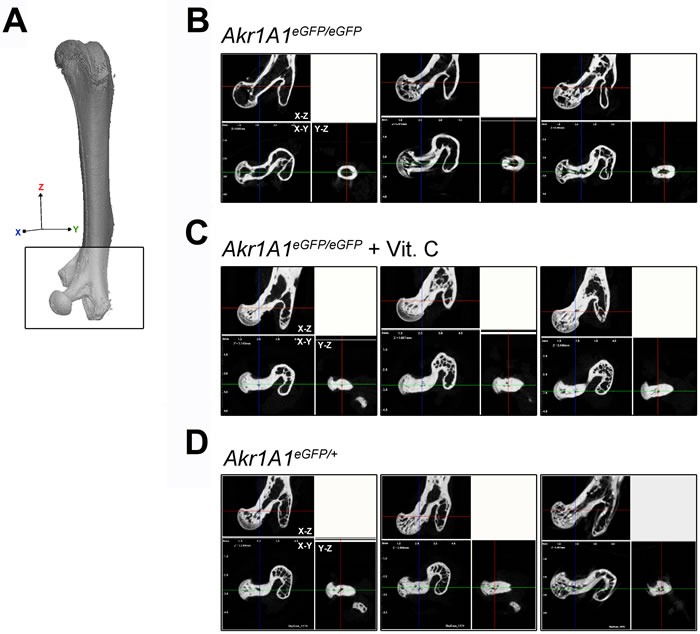
A. The micro-CT analyzed region of femoral head and neck at the proximal femur (the square region). The X, Y, Z axis represented the orientation of the femur. B., C. and D. The sections of the X-Z, X-Y and Y-Z axial planes of the proximal femurs in Akr1A1eGFP/eGFP, Akr1A1eGFP/eGFP with ascorbic acid supplement and Akr1A1eGFP/+ mice, respectively, and the results were showed in triplicate.