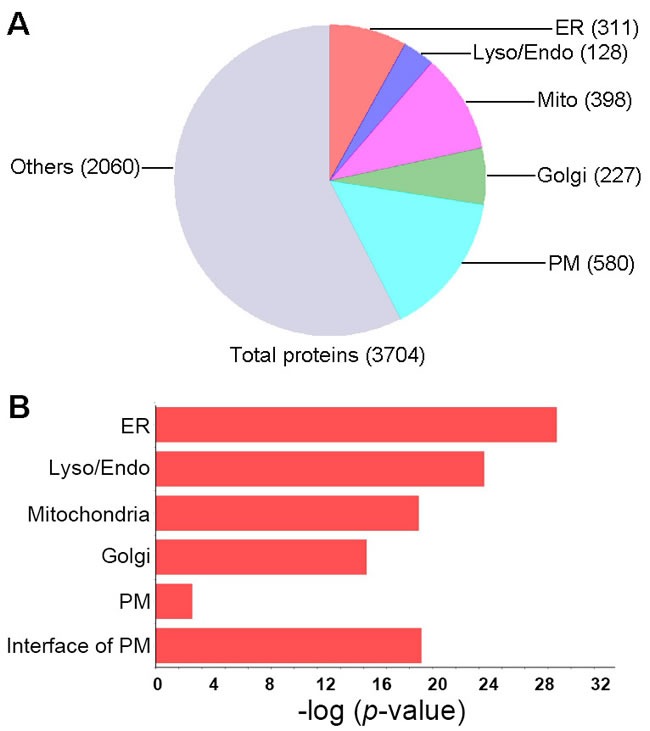
Figure 2. Subcellular distribution of the proteins in lysosomes.

A., Distribution of the proteins identified in lysosome mass spectrometry according to their subcellular annotation. Proteins identified in lysosome were mapped to GO terms of cellular components using DAVID tool, number of proteins in each category was presented. The annotation of proteins localization in other subcellular regions was merged as the “Other” category. ER, endoplasmic reticulum; Mito, mitochondrion; Lyso/Endo, lysosome/endosome; Golgi, Golgi apparatus. B., Distribution of the proteins according to the significance of their enrichment in the subcellular localization. P-values were calculated by DAVID tool.
