
Figure 4. Comparative and network analyses of upregulated proteins in lysosomes.
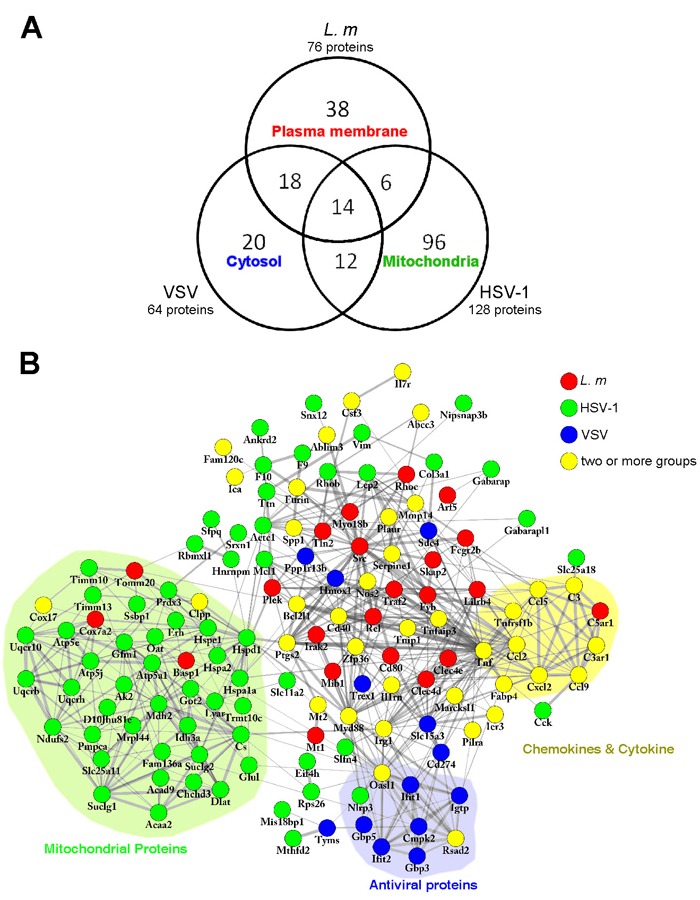
A., Venn diagram showing the overlap of upregulated proteins (more than 2-fold) between each group. Numbers in each area represents the number of proteins in that category. The descriptions represent the subcellular localizations with highest enrichment in that category. B., Upregulated proteins were submitted to STRING for further analysis for protein-protein interaction. Networks were visualized by Cytoscape software. Proteins upregulated by different treatments are indicated by different colors. The proteins of related functions are labeled and indicated by colored backgrounds.