
Figure 5. Analysis of lysosome-related glycoproteins.
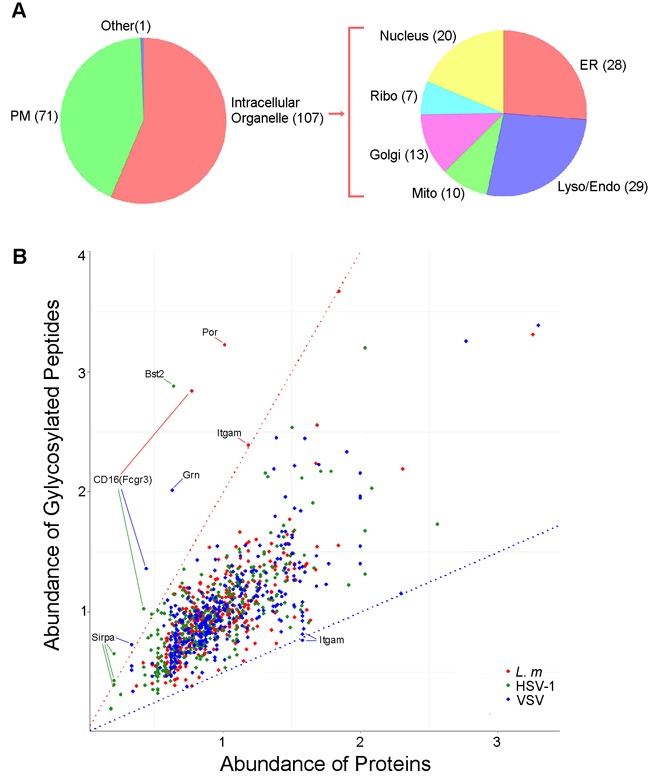
A., Subcellular distribution of glycoproteins in lysosomes. 193 Lysosome-related glycolproteins identified with mass spectrum were mapped to 179 GO terms of cellular components using DAVID tools, number of proteins in each category was presented. Further classification of intracellular localization is shown. ER, endoplasmic reticulum; Mito, mitochondrion; Lyso/Endo, lysosome/endosome; Golgi, Golgi apparatus, Ribo, ribosome. B., Dot plot showing the relative abundance of 300 glycosylated peptides and proteins that each peptide represented; the source of the peptides is indicated by colors. Red and blue dotted lines represent abundance ratios that equal to 2:1 and 1:2, respectively. The peptides that are more glycosylated (with a ratio 02C32:1) and less glycosylated (with a ratio 02C21:2) are labeled.