
Figure 6. Further analysis of mass spectrometry (MS) results by Western blotting.
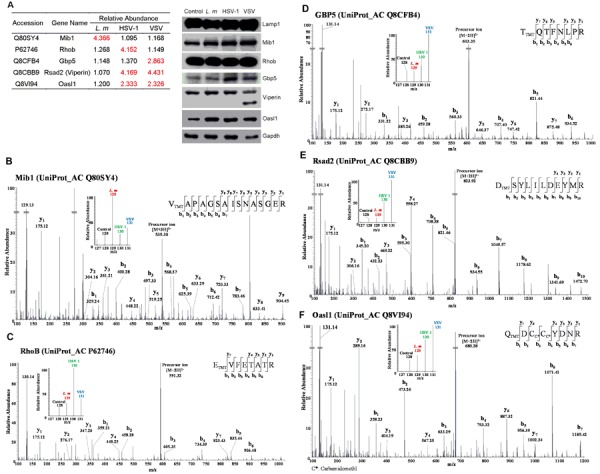
A., Immunity-related proteins chosen for Western blot analysis. Relative abundance of 5 proteins quantified by mass spectrum were shown in table. Fold change > 2 is labeled in red (left panel). Right panel, similar amounts of protein extracts from control or infected cells were probed with antibodies against chosen proteins (Mib1, RhoB, Gbp5, Rsad2 and Oasl1). Lamp1 and GAPDH served as loading controls. B.-F., MS/MS data of represented peptides of chosen proteins. TMT-128 indicates control; TMT-129 indicates L. m infection; TMT-130 indicates HSV-1 infection; and TMT-131 indicates VSV infection.