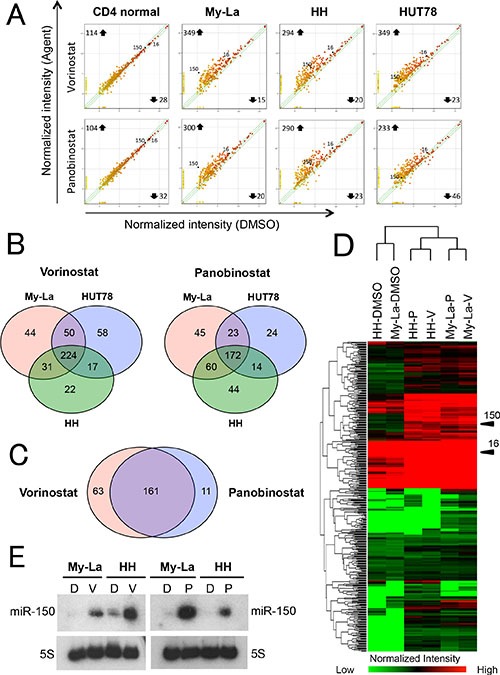
Figure 2. miRNA expression analysis of HDACIs-treated CTCL cell lines.

(A) miRNA expression analysis of CTCL cells and normal CD4+T-cells. X- and Y-axes, intensity of miRNAs treated with dimethyl sulfoxide (DMSO) and pan-HDACIs (vorinostat and panobinostat), respectively. Normal CD4+T-cells, My-La, MJ, HH, and HUT78 cells treated with vorinostat (5 μM) or panobinostat (80 nM) for 24 hr. (B) Commonly upregulated miRNAs in My-La, HH, and HUT78 cells treated with vorinostat (left) or panobinostat (right). (C) Commonly upregulated miRNAs in My-La, HH, and HUT78 treated with vorinostat and panobinostat. (D) Heat map of My-La and HH cell lines treated with and without pan-HDACIs [vorinostat (V), panobinostat (P)]. (E) Northern blot analysis of miR-150 in the My-La and HH cell lines treated with vorinostat (V) or panobinostat (P). DMSO (D), control. 5S tRNA (5S), control.
