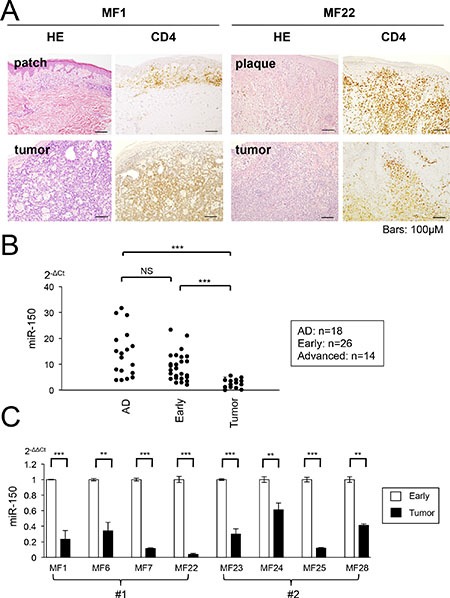
Figure 5. miR-150 is downregulated during progression of primary CTCL cases.

(A) Photomicrographs of early and tumor phase of mycosis fungoides (MF) samples collected from same patients (MF1 and MF22). Hematoxylin and eosin (H&E) and CD4+ staining are shown. (B) qRT-PCR analysis of miR-150 in tissue samples of normal atopic dermatitis (AD, n = 18), early MF (n = 26), and tumor phase MF (n =14). Y-axis: 2-ΔCt values for miRNA expression. P-values were calculated using Mann-Whitney U test. ***P < 0.001. NS: not significant. (C) Comparison of miR-150 expression between early and tumor MF in same patients (eight cases). #1: miR-150 expression of different clinical courses (MF1, MF6, MF7, and MF22), #2: miR-150 expression of the same patient from different biopsy regions patch/plaque and tumor (MF23, MF24, MF25, and MF28). Student's t-test was used to examine significance. **0.001 ≤ P < 0.01, ***P < 0.001. Bars are means ± standard error of the mean (SEM) of three independent experiments.
