
Figure 1. Characterization of OTX015 antiproliferative activity in three TNBC cell models.
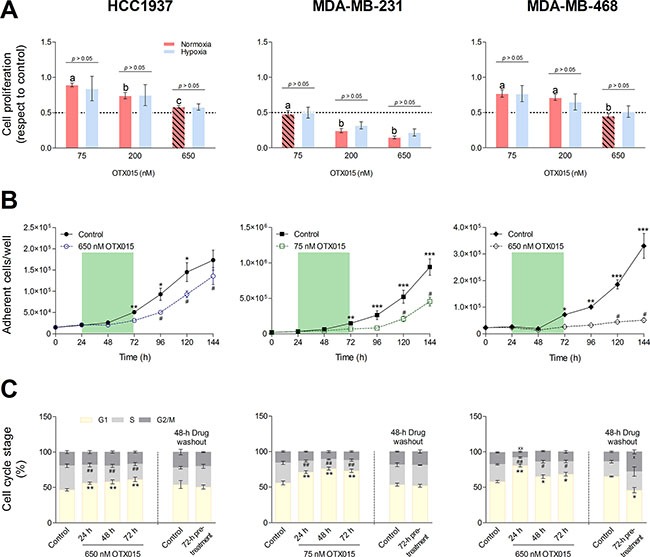
(A) Cells were seeded under normoxic and hypoxic conditions and treated with OTX015 for 72 h. The antiproliferative effect was determined by cell counting. The diagonal-line pattern ( ) indicates OTX015 concentrations that decreased cell growth by 50% (GI50). For each treatment, the influence of hypoxia on antiproliferative activity was evaluated with the Student t-test. Significant differences in the OTX015 treatments were determined with a one-way ANOVA test (p < 0.01) followed by an SNK a posteriori test; substantial differences (p < 0.05) are indicated as letters above the bars. (B) Cell lines were treated with OTX015 for 72 h (indicated by the green area) and then cultured in drug-free medium. The Y axis represents the number of cells per well evaluated every 24 h after cell seeding (time 0). Significant differences in the number of control and treated cells at each time point were determined by two-way ANOVA test (p < 0.001) followed by a Bonferroni a posteriori test (*p < 0.05, **p < 0.01, ***p < 0.001). Significant differences at each time point after washout versus 72 h-treated cells were determined with one-way ANOVA test (p < 0.01) followed by an SNK a posteriori test (#p < 0.05). (C) Cells were treated with OTX015 for 24, 48 and 72 h and the latter cells were further cultured without OTX015 for 48 h (drug washout). Significant differences in the percentage of OTX015-treated cells in the G1, S and G2/M phases with respect to untreated controls were evaluated by a one-way ANOVA test (p < 0.01) followed by an SNK a posteriori test. After washout, differences in the percentage of cells in a given cell cycle phase between control and pretreated cells were determined with the Student t-test. Significant differences between treated cells and controls were reported for the G1 phase (*p < 0.05, **p < 0.01), S phase (#p < 0.05, ##p < 0.01) and G2/M phase (×p < 0.05, ××p < 0.01). Each dot or bar and vertical line represents the mean ± SEM, respectively (n ≥ 3).